Fig. 8.
Download original image
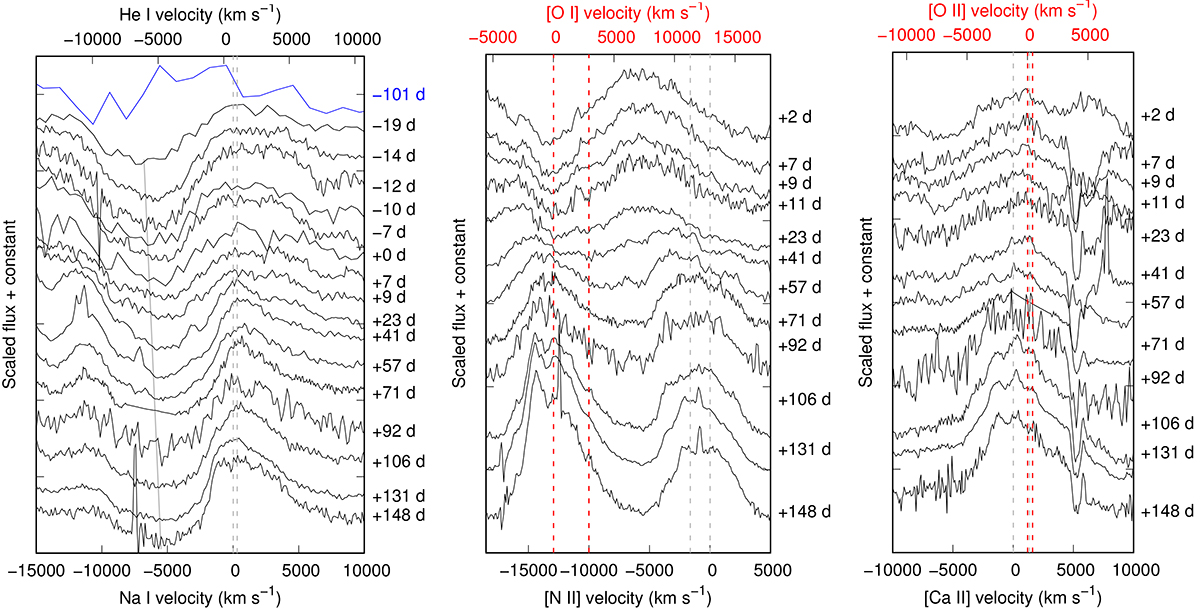
Left: evolution of the Na Iλλ5890,5986 line (dashed gray lines), possibly blended with He Iλ5876. The approximate evolution of the absorption minimum from a Gaussian fit after −19 d is marked with a solid gray line. The velocity evolution is slow during the second peak and the subsequent decline. Middle: evolution of the putative [O I] λλ6300,6364 (dashed red lines) and [N II] λλ6548,6584 (dashed gray lines) doublets after the second peak. Both start to appear between +41 and +71 d and strengthen over time. Right: evolution of the [Ca II] λλ7291,7323 (dashed gray lines) + [O II] λλ7320,7330 (dashed red lines) feature. Zero velocity refers to the stronger line of each doublet. All forbidden features shown here are double-peaked at late times.
Current usage metrics show cumulative count of Article Views (full-text article views including HTML views, PDF and ePub downloads, according to the available data) and Abstracts Views on Vision4Press platform.
Data correspond to usage on the plateform after 2015. The current usage metrics is available 48-96 hours after online publication and is updated daily on week days.
Initial download of the metrics may take a while.