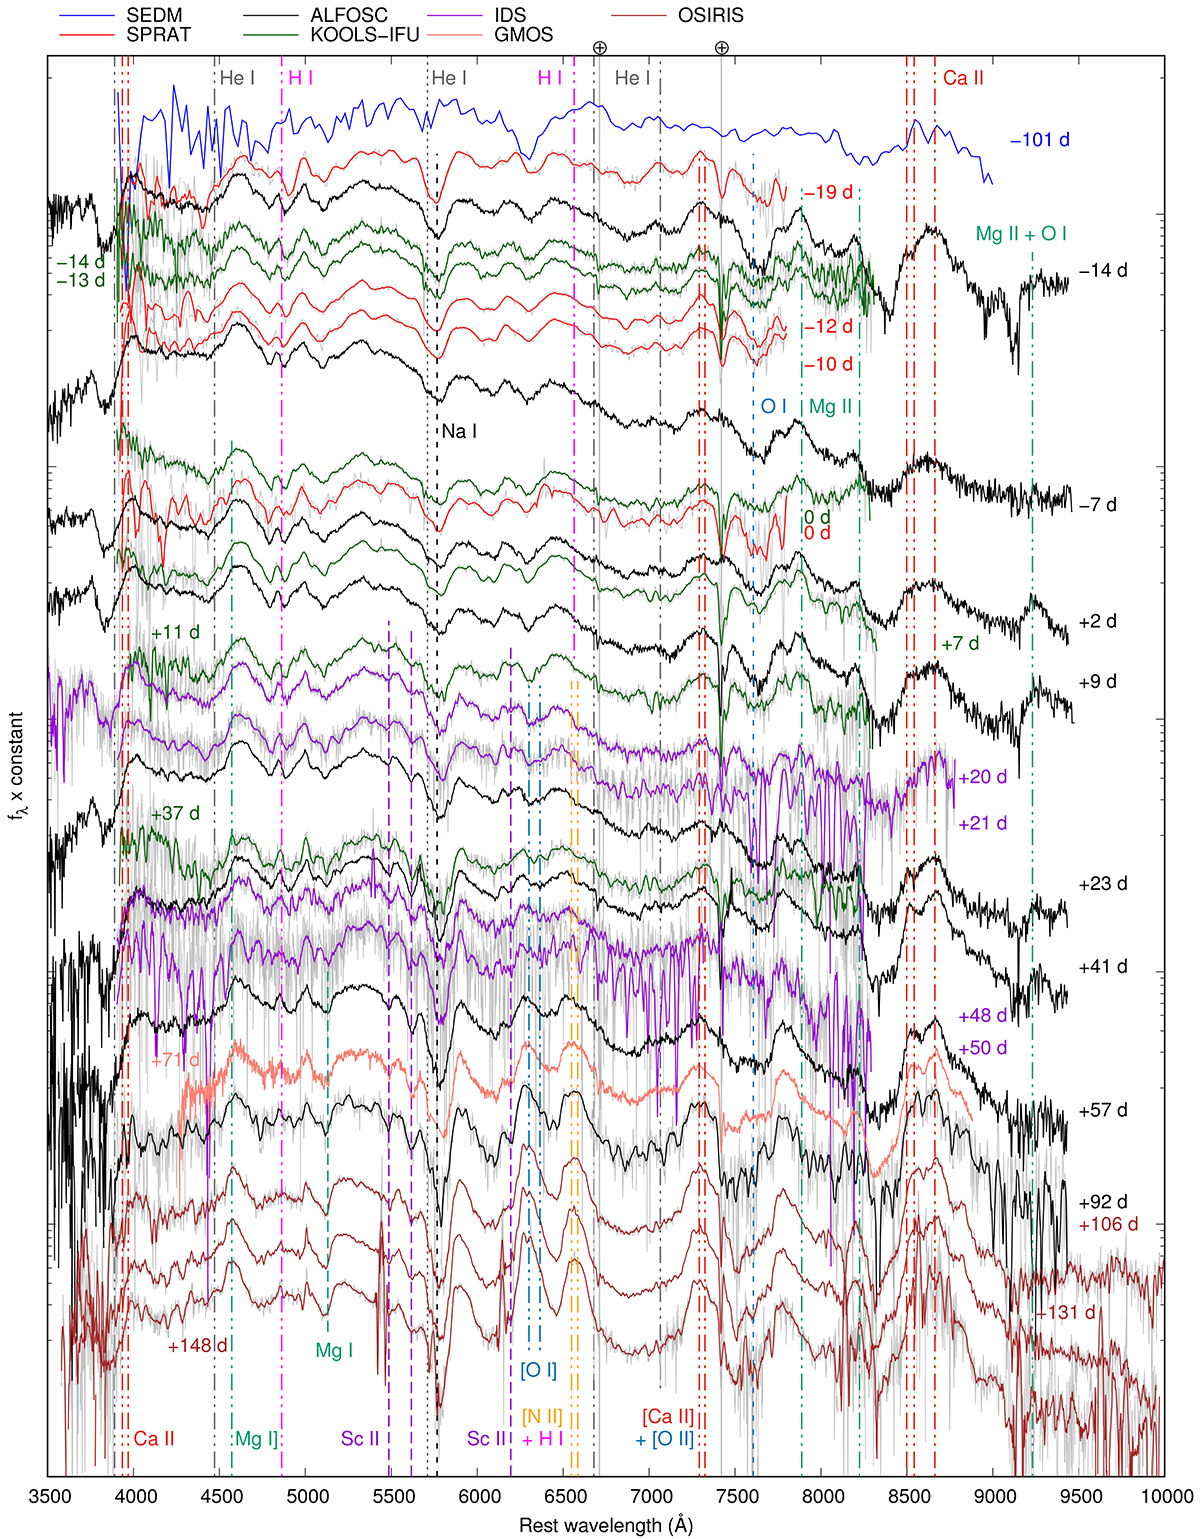
Fig. 7.
Download original image
Spectral evolution of the first (blue; Wise et al. 2023) and second peak of SN 2023aew. Different instruments are color-coded, and epochs refer to the second peak. Telluric absorption lines (⊕) are marked with solid light gray lines. Dash-dotted lines are at zero velocity (of the stronger line in case of a close doublet); long dashes at −2500 km s−1; short dashes at −6500 km s−1; and dotted lines at −8500 km s−1. When Savitzky–Golay smoothing has been applied, the original spectrum is plotted in gray.
Current usage metrics show cumulative count of Article Views (full-text article views including HTML views, PDF and ePub downloads, according to the available data) and Abstracts Views on Vision4Press platform.
Data correspond to usage on the plateform after 2015. The current usage metrics is available 48-96 hours after online publication and is updated daily on week days.
Initial download of the metrics may take a while.