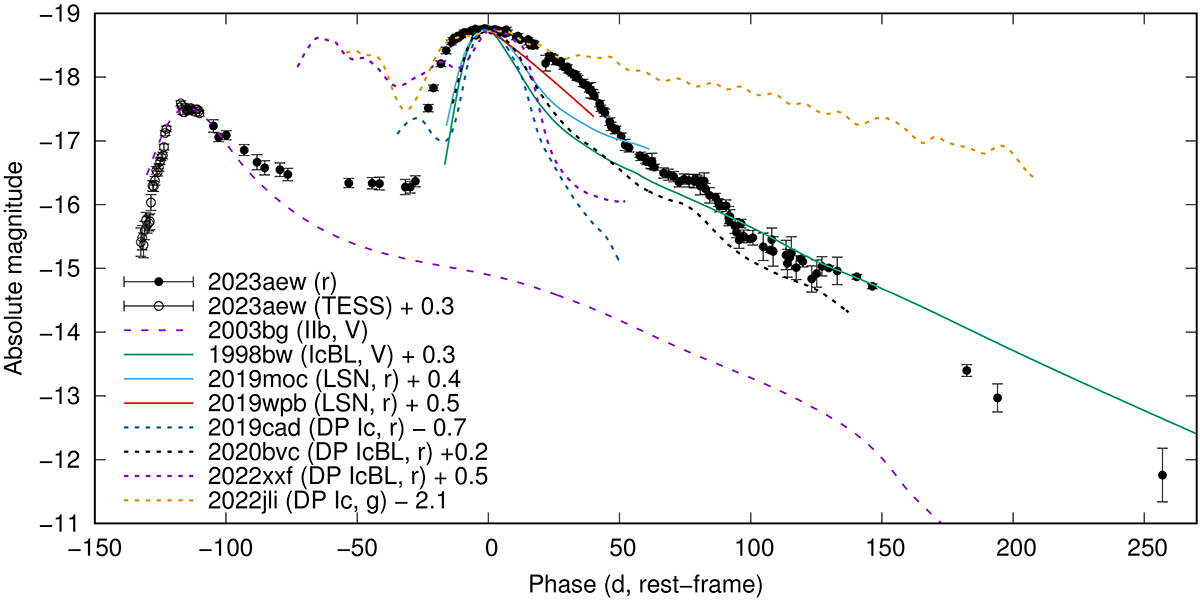
Fig. 6.
Download original image
Comparison of the light curve of SN 2023aew (points) to other SE-SNe (lines). The first peak at first resembles SN 2003bg (dashed purple line; Hamuy et al. 2009), until the flattening around −100 d. The second peak has a luminosity similar to the Type Ic-BL SN 1998bw (Galama et al. 1998; McKenzie & Schaefer 1999) and LSNe (Gomez et al. 2022) (solid lines), but a much slower evolution. Of the double-peaked SE-SNe (DP; dotted lines) pictured here – SNe 2019cad (Gutiérrez et al. 2021), 2020bvc (Ho et al. 2020; Izzo et al. 2020), 2022xxf (Kuncarayakti et al. 2023), and 2022jli (Chen et al. 2024) – only SN 2020bvc resembles the late-time light curve of SN 2023aew, and the separation between peaks is much shorter in all of them than in SN 2023aew.
Current usage metrics show cumulative count of Article Views (full-text article views including HTML views, PDF and ePub downloads, according to the available data) and Abstracts Views on Vision4Press platform.
Data correspond to usage on the plateform after 2015. The current usage metrics is available 48-96 hours after online publication and is updated daily on week days.
Initial download of the metrics may take a while.