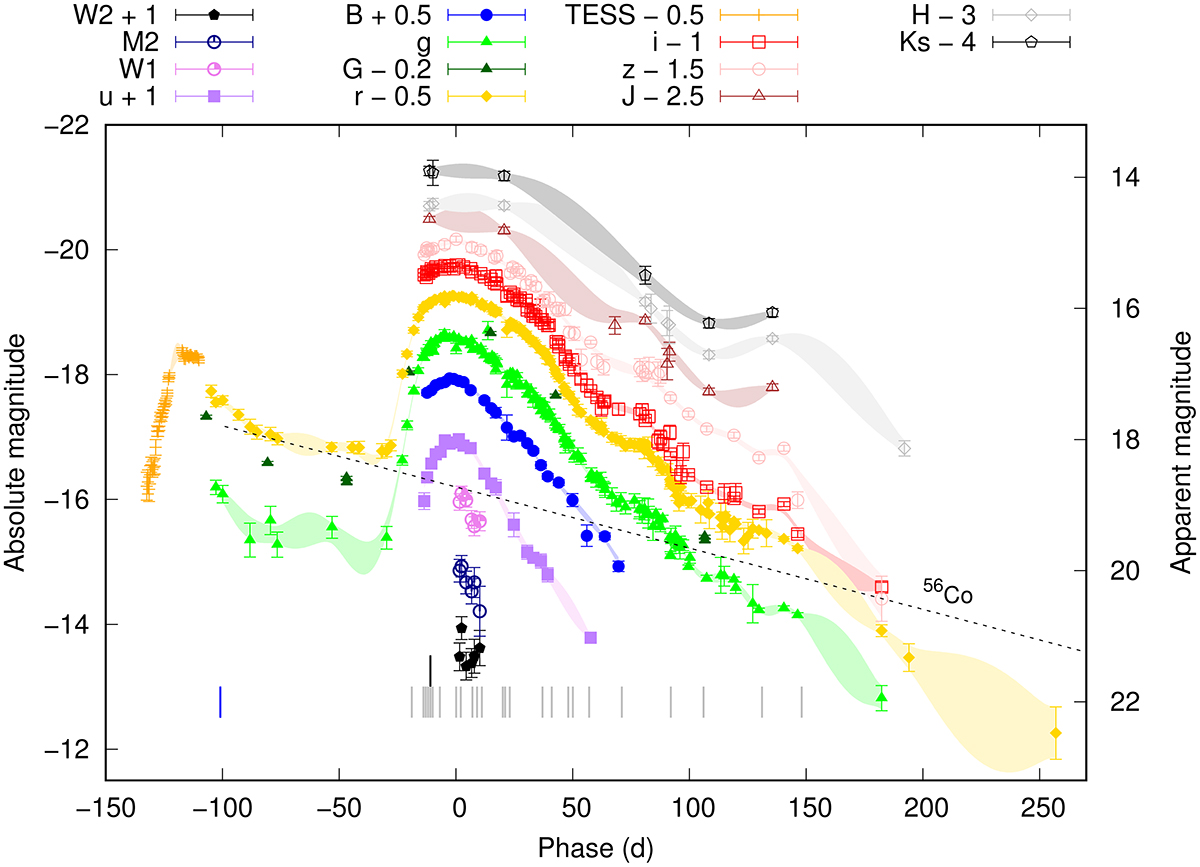
Fig. 4.
Download original image
NUV, optical, and NIR light curve of SN 2023aew. G-band errors are not reported at Gaia Alerts, and only the distance uncertainty is included. The shaded regions correspond to the 68% uncertainties of our GP fits. The decay rate of 56Co is indicated with a dashed black line. Our optical spectral coverage is indicated with gray vertical lines and our NIR spectrum with a black vertical line. The epoch of the classification spectrum (Wise et al. 2023) is marked with a blue vertical line. All magnitudes have been corrected for Galactic extinction. Phases refer to the second r-band peak (MJD = 60074.9).
Current usage metrics show cumulative count of Article Views (full-text article views including HTML views, PDF and ePub downloads, according to the available data) and Abstracts Views on Vision4Press platform.
Data correspond to usage on the plateform after 2015. The current usage metrics is available 48-96 hours after online publication and is updated daily on week days.
Initial download of the metrics may take a while.