Fig. 3.
Download original image
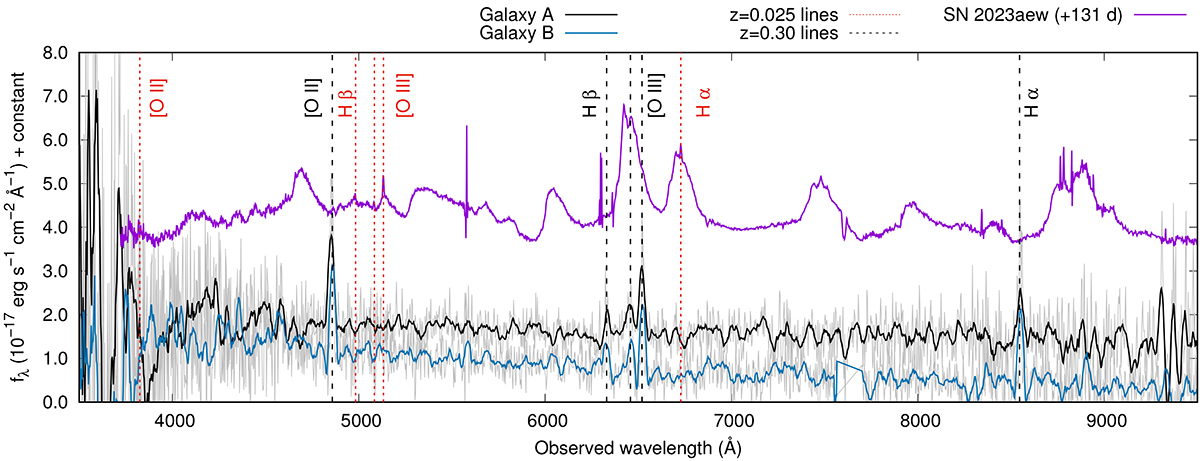
NOT/ALFOSC spectra of Galaxies A (black) and B (blue) and the GTC/OSIRIS spectrum of SN 2023aew at +131 d showing narrow host lines (purple). Savitzky–Golay smoothing has been applied to the original ALFOSC spectra (gray). Identified lines of [OII], [OIII], and H at z = 0.30 are plotted as black dashed vertical lines. The same lines are also plotted at the redshift of SN 2023aew, z = 0.025, as red dotted vertical lines. No lines are detected at this redshift in Galaxies A and B.
Current usage metrics show cumulative count of Article Views (full-text article views including HTML views, PDF and ePub downloads, according to the available data) and Abstracts Views on Vision4Press platform.
Data correspond to usage on the plateform after 2015. The current usage metrics is available 48-96 hours after online publication and is updated daily on week days.
Initial download of the metrics may take a while.