Fig. 9.
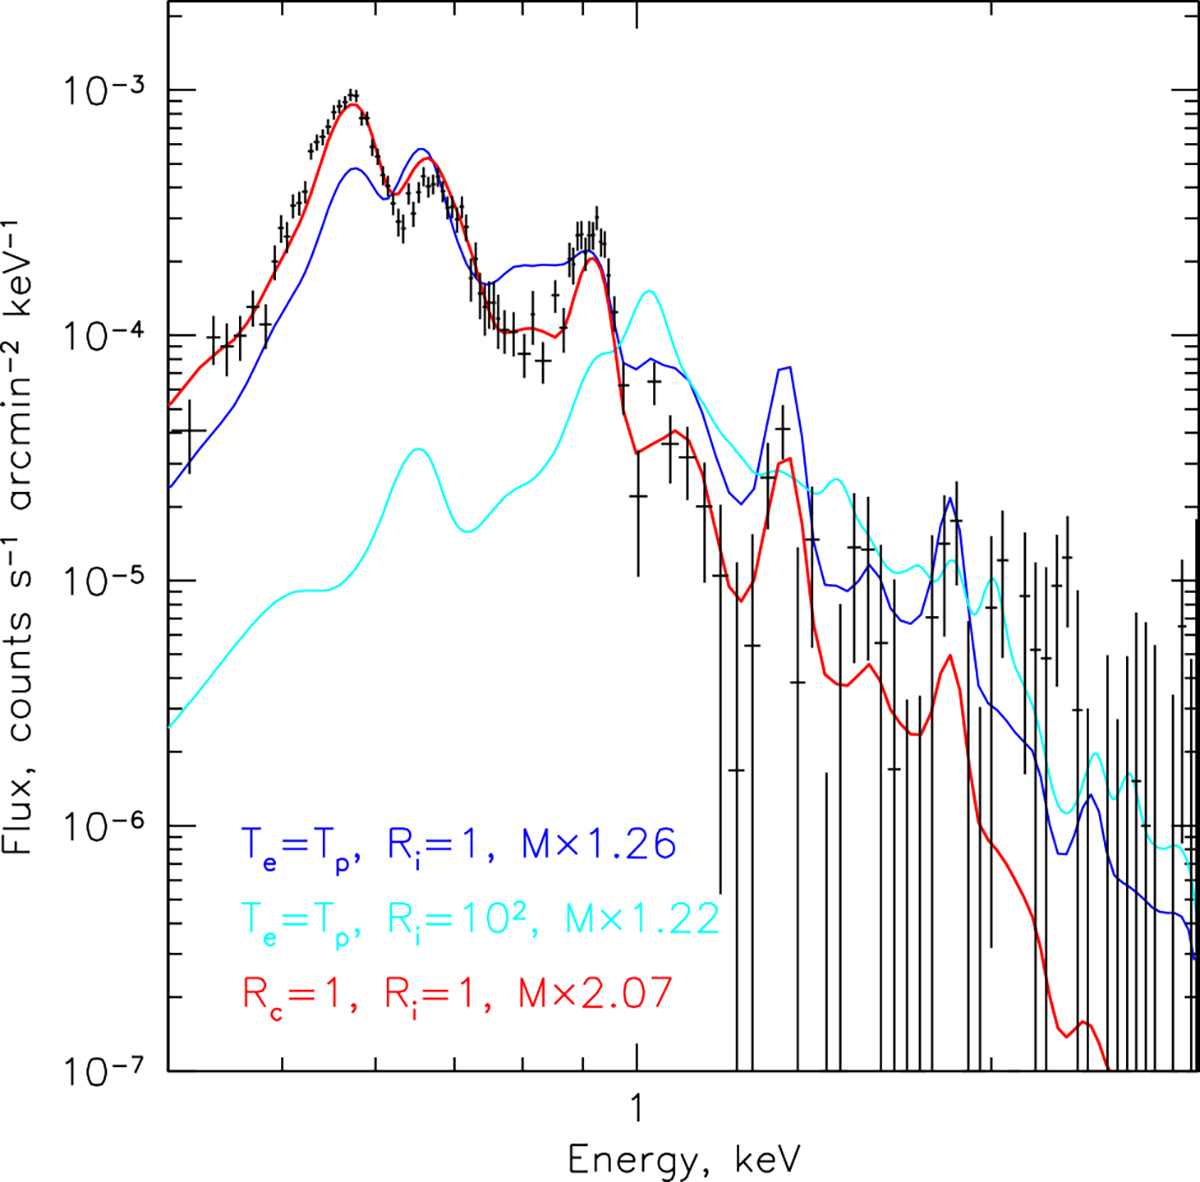
Download original image
SNR spectra based on the 1D hydro model shown in Fig. 8 at t = 3 × 10⁴ yr. The black crosses are the same data points as in Fig. 5. The models (blue, cyan, and red curves) differ in the level of deviation from the CIE state with Te = Ti. In particular, the blue curve corresponds to instantaneous electron and proton temperature equilibration (that is, Te = Tp = Ti) and the self-consistently calculated evolution of the ionization balance. The cyan curve shows the case when the rate of all collisional processes is artificially increased by a factor of 100 (i.e., this case is close to the CIE state with Te = Ti). The red curve shows the case in which most of the energy downstream of the shock goes into protons, and the electron and proton equilibration proceeds via pure Coulomb collisions. In all cases, the ionization balance is followed in each shell according to the time evolution of the electron temperature. The model spectra were integrated along the line of sight at a projected distance of 0.35 times the radius of the SNR.
Current usage metrics show cumulative count of Article Views (full-text article views including HTML views, PDF and ePub downloads, according to the available data) and Abstracts Views on Vision4Press platform.
Data correspond to usage on the plateform after 2015. The current usage metrics is available 48-96 hours after online publication and is updated daily on week days.
Initial download of the metrics may take a while.