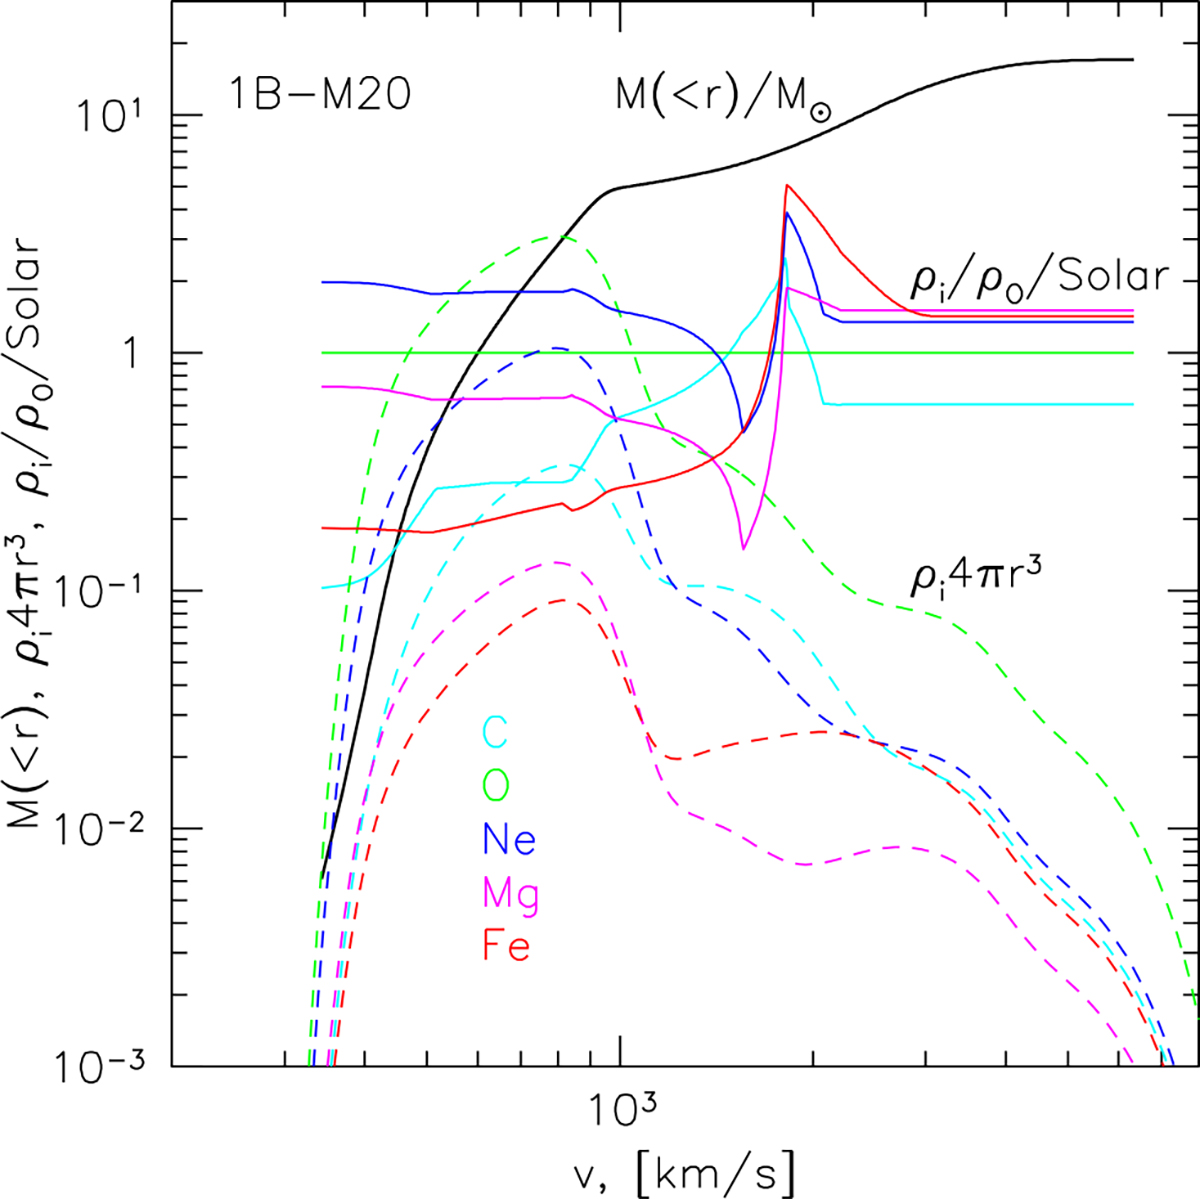
Fig. 7.
Download original image
Ejecta structure for the 1B-M20 model. The solid black line shows the enclosed ejecta mass (for a given velocity). The dashed colored lines show which velocities make the largest contribution to the mass of a given element; namely, the quantity 4πr3ρi, where ρi is the mass density of the i-th element, color-coded as in the legend. The solid colored lines show the mass density of the i-th element relative to the mass density of oxygen, normalized by the solar value.
Current usage metrics show cumulative count of Article Views (full-text article views including HTML views, PDF and ePub downloads, according to the available data) and Abstracts Views on Vision4Press platform.
Data correspond to usage on the plateform after 2015. The current usage metrics is available 48-96 hours after online publication and is updated daily on week days.
Initial download of the metrics may take a while.