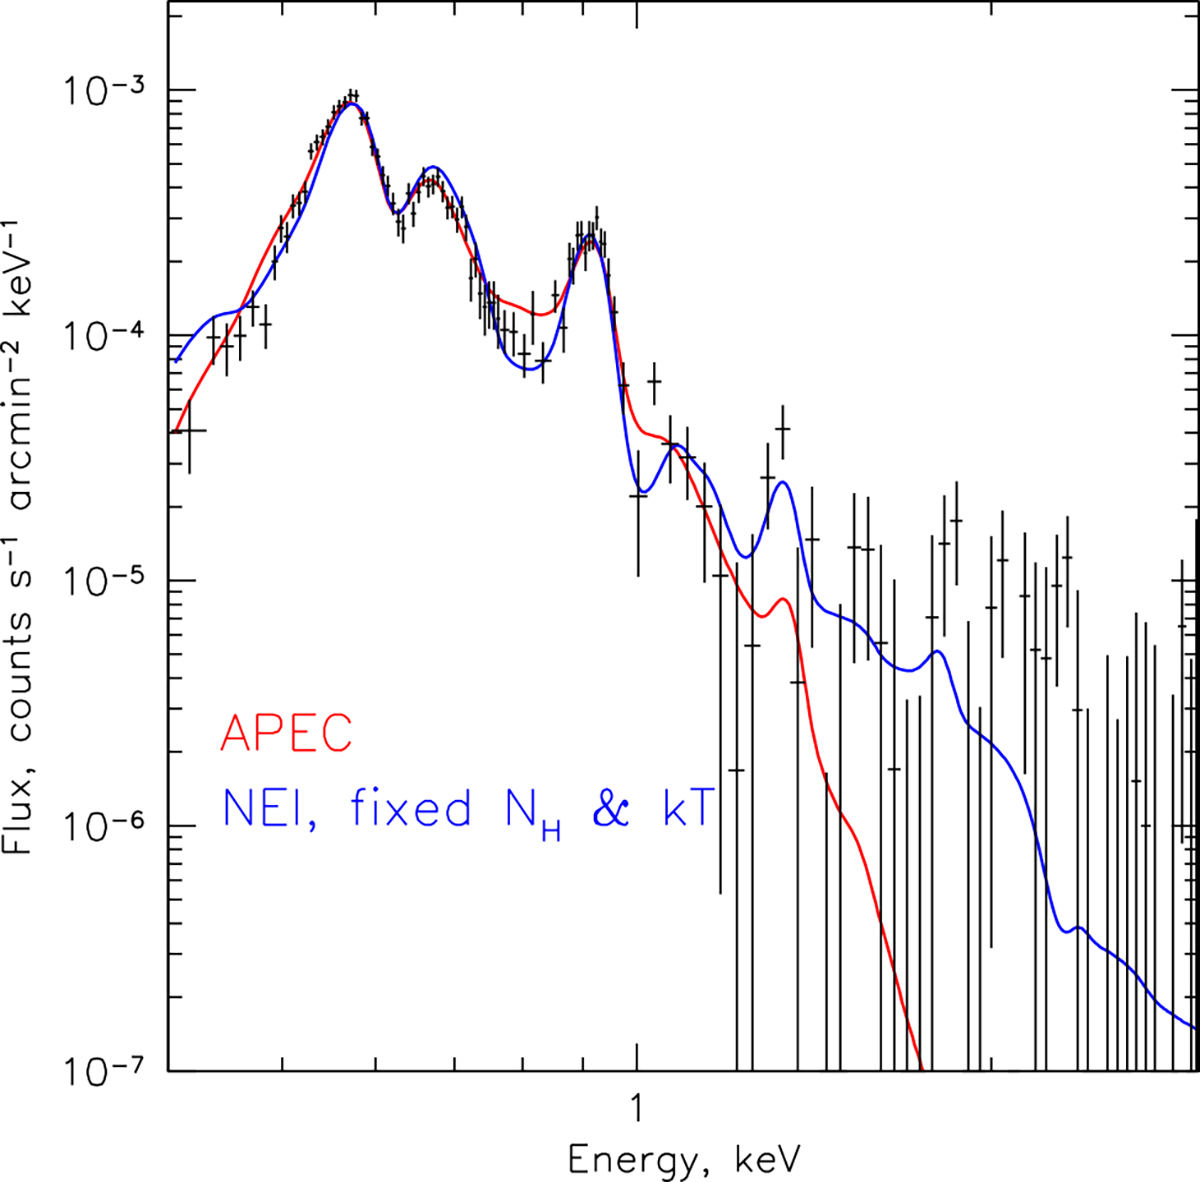
Fig. 5.
Download original image
X-ray spectrum of the entire S147 SNR. The red line shows the best-fitting APEC model (single-temperature, CIE, solar abundance of metals). This model requires a very large absorbing column density, overpredicts the flux near 0.8 keV (where a significant contribution of Fe XVII line at 826 eV is expected), and underpredicts the Mg XI line flux unless its abundance (relative to oxygen) is very high. For comparison, the blue line shows the NEI model with parameters fixed at physically motivated values. Although formally the value of χ2 is higher than for the APEC model, the lower value of NH and the ability of the model to better describe regions near Fe XVII and Mg XI lines make this model an appealing interpretation of the S147 spectrum (see text for details).
Current usage metrics show cumulative count of Article Views (full-text article views including HTML views, PDF and ePub downloads, according to the available data) and Abstracts Views on Vision4Press platform.
Data correspond to usage on the plateform after 2015. The current usage metrics is available 48-96 hours after online publication and is updated daily on week days.
Initial download of the metrics may take a while.