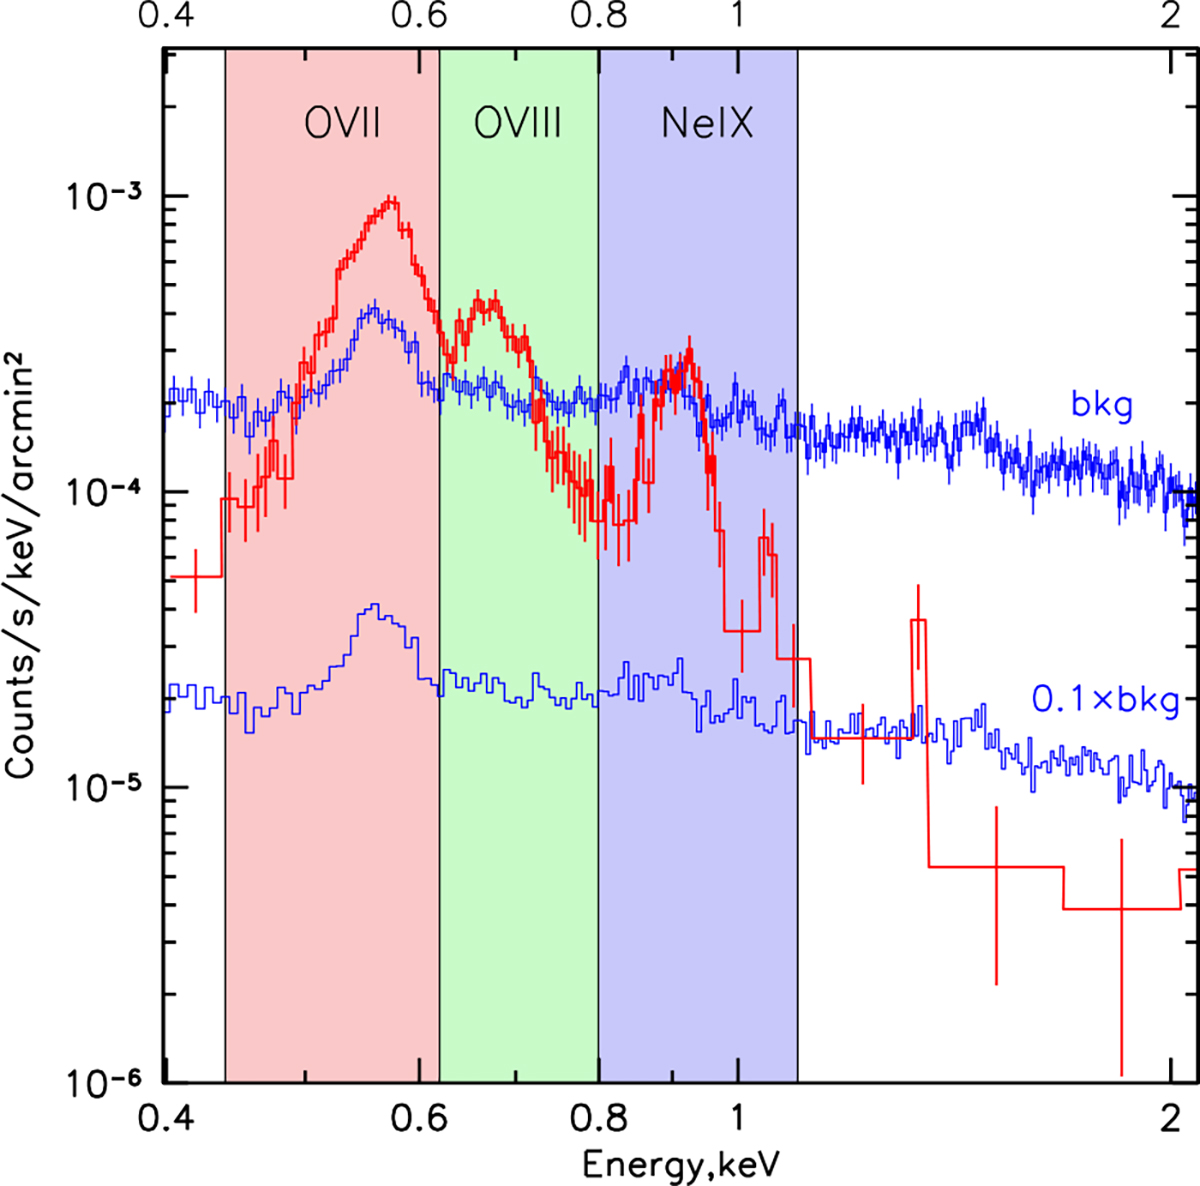
Fig. 3.
Download original image
X-ray spectrum of the whole remnant (red data points) after subtraction of the background signal (blue data points) estimated from an adjacent sky region. Also shown is the level of 10% of the background emission, which aims to show that above 1.5 keV the SN signal amounts to a few % of the background level, making conclusions regarding its spectral shape at these energies strongly background-sensitive. The three bands containing the brightest emission lines are shown in red (O VII), green (O VII), and blue (Ne IX), and are used for RGB composite images.
Current usage metrics show cumulative count of Article Views (full-text article views including HTML views, PDF and ePub downloads, according to the available data) and Abstracts Views on Vision4Press platform.
Data correspond to usage on the plateform after 2015. The current usage metrics is available 48-96 hours after online publication and is updated daily on week days.
Initial download of the metrics may take a while.