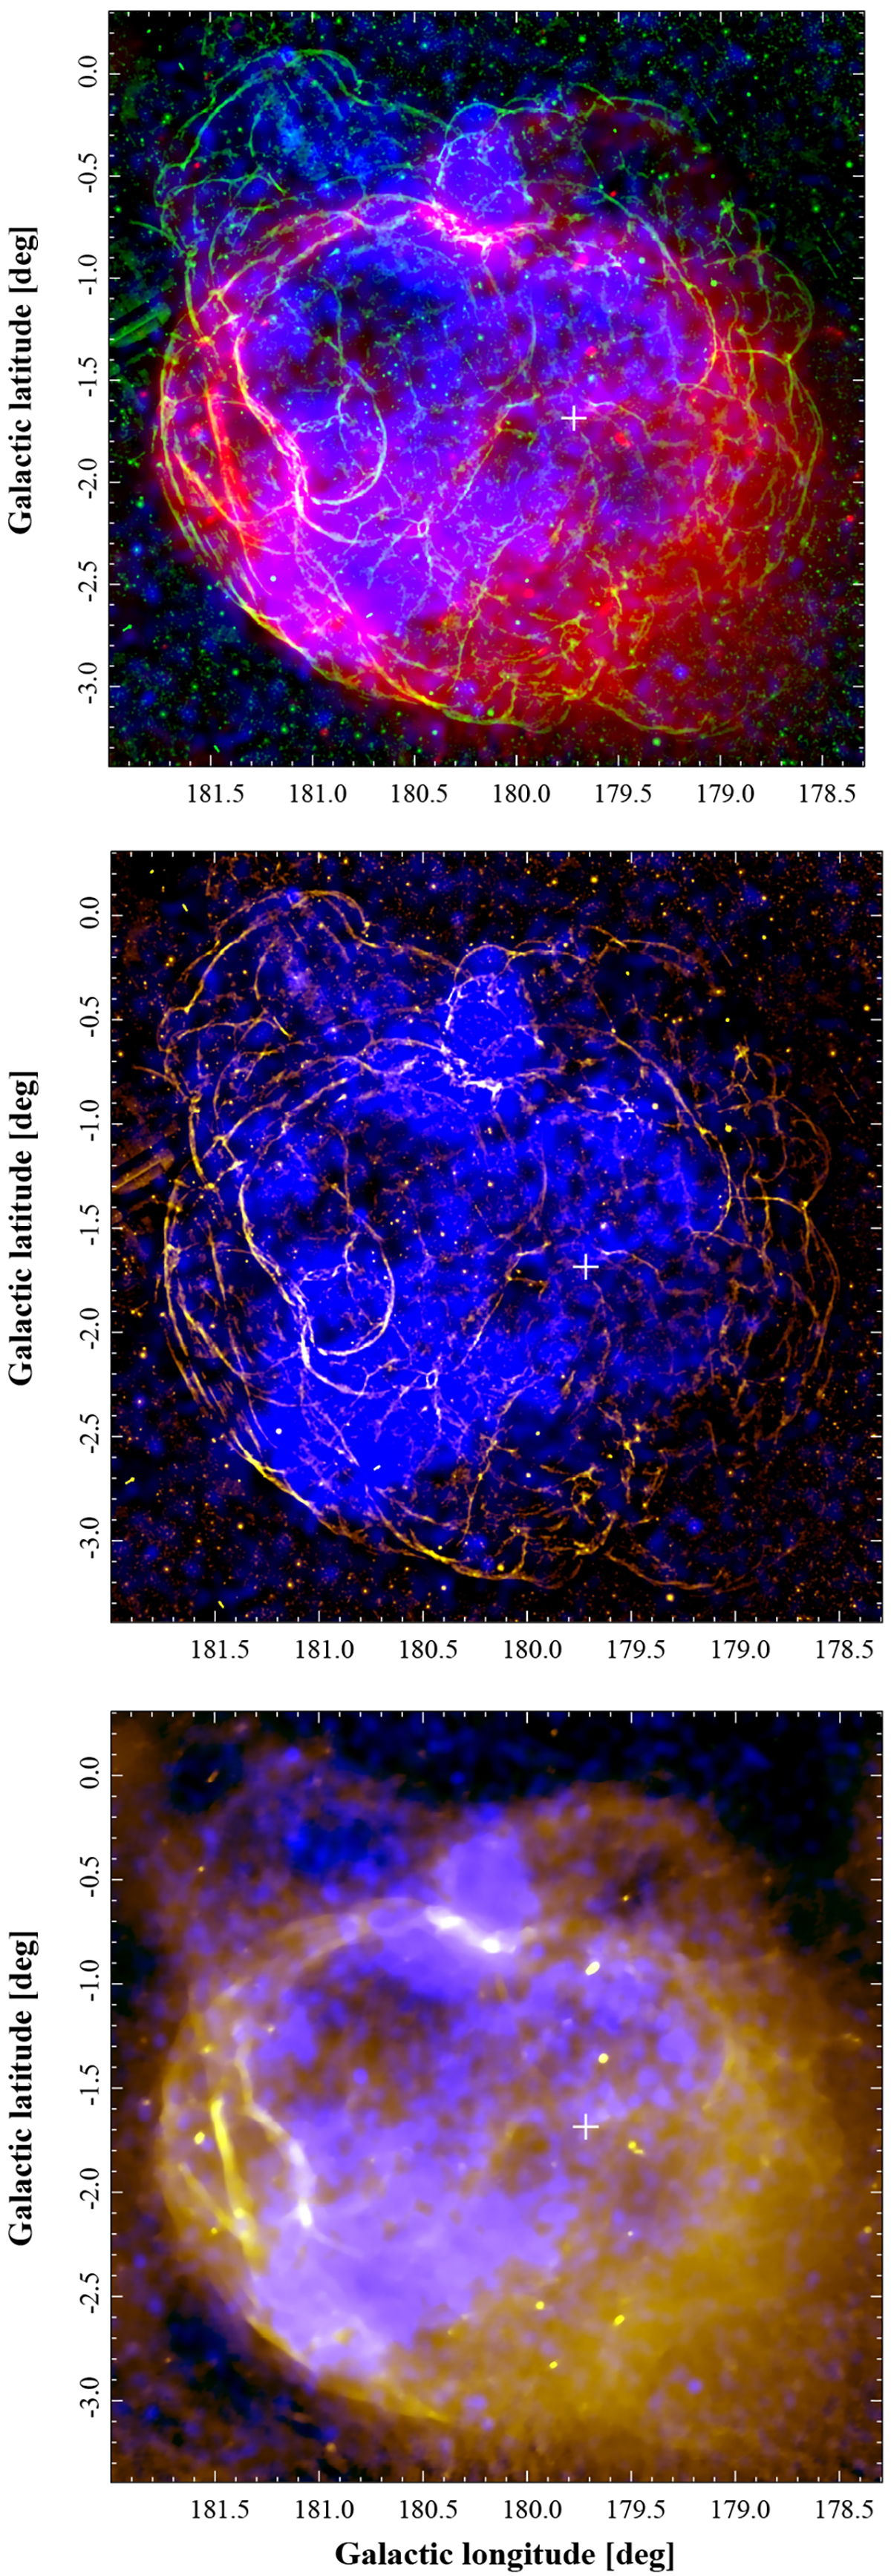
Fig. 2.
Download original image
Multiwavelength view of S147 (in Galactic coordinates). Top: combined map of the radio (CGPS data at 1.4 GHz, red), wavelet-decomposed (in order to emphasize filamentary structure) Hα (IGAPS data, green), and broadband X-ray (0.5–1.1 keV, SRG/eROSITA data, blue) emission. The white cross marks the position of PSR J0538+2817. Middle: the intensity-saturated X-ray image is shown in blue on top of the wavelet-decomposed Hα image, demonstrating that X-ray emission is confined by the Hα-emitting shell. Bottom: same as the middle panel but with the 1.4 GHz radio emission as a background.
Current usage metrics show cumulative count of Article Views (full-text article views including HTML views, PDF and ePub downloads, according to the available data) and Abstracts Views on Vision4Press platform.
Data correspond to usage on the plateform after 2015. The current usage metrics is available 48-96 hours after online publication and is updated daily on week days.
Initial download of the metrics may take a while.