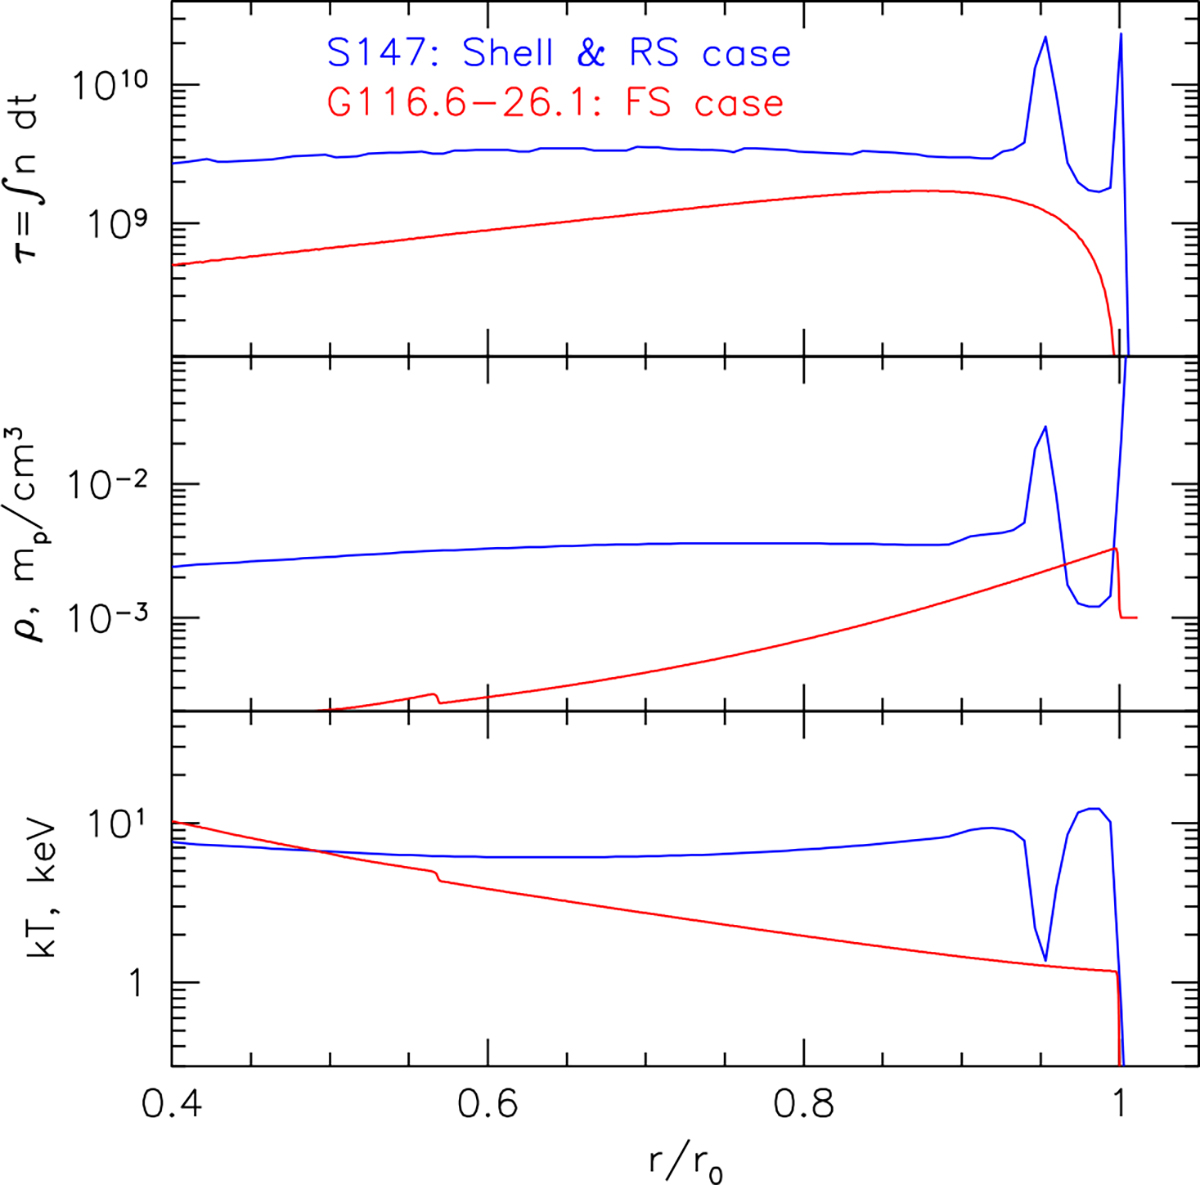
Fig. 11.
Download original image
Radial profile of the ionization parameter, τ = ∫ndt (blue line, top panel) based on the 1D model, in which most of the X-ray emission is coming from the gas reheated by the reverse shock following the collision of the ejecta with the dense shell. The radius is normalized by the characteristic radius, r0, which is approximately equal to the radius of the forward shock. Small amplitude irregularities in the black curve at r/r0 ≲ 0.8 are an artifact of τ calculations. For comparison, the red curve shows the case in which the X-ray emission is mostly due to the gas heated by the forward shock (the parameters for G116-26.1 are used here). Two spikes in τ are clearly visible at large radii. The outmost spike is likely an artifact of our non-radiative run near the inner boundary of the dense shell. The other spike is due to the less-dense gas (outer layers of ejecta) that has a relatively high temperature and can contribute to X-ray emission. In this region, oxygen might be completely ionized, but the lines of Si and Fe might be present, as is illustrated in Fig. 12. The middle and bottom panels compare the model density and temperature profiles for these two SNRs.
Current usage metrics show cumulative count of Article Views (full-text article views including HTML views, PDF and ePub downloads, according to the available data) and Abstracts Views on Vision4Press platform.
Data correspond to usage on the plateform after 2015. The current usage metrics is available 48-96 hours after online publication and is updated daily on week days.
Initial download of the metrics may take a while.