Fig. A.1
Download original image
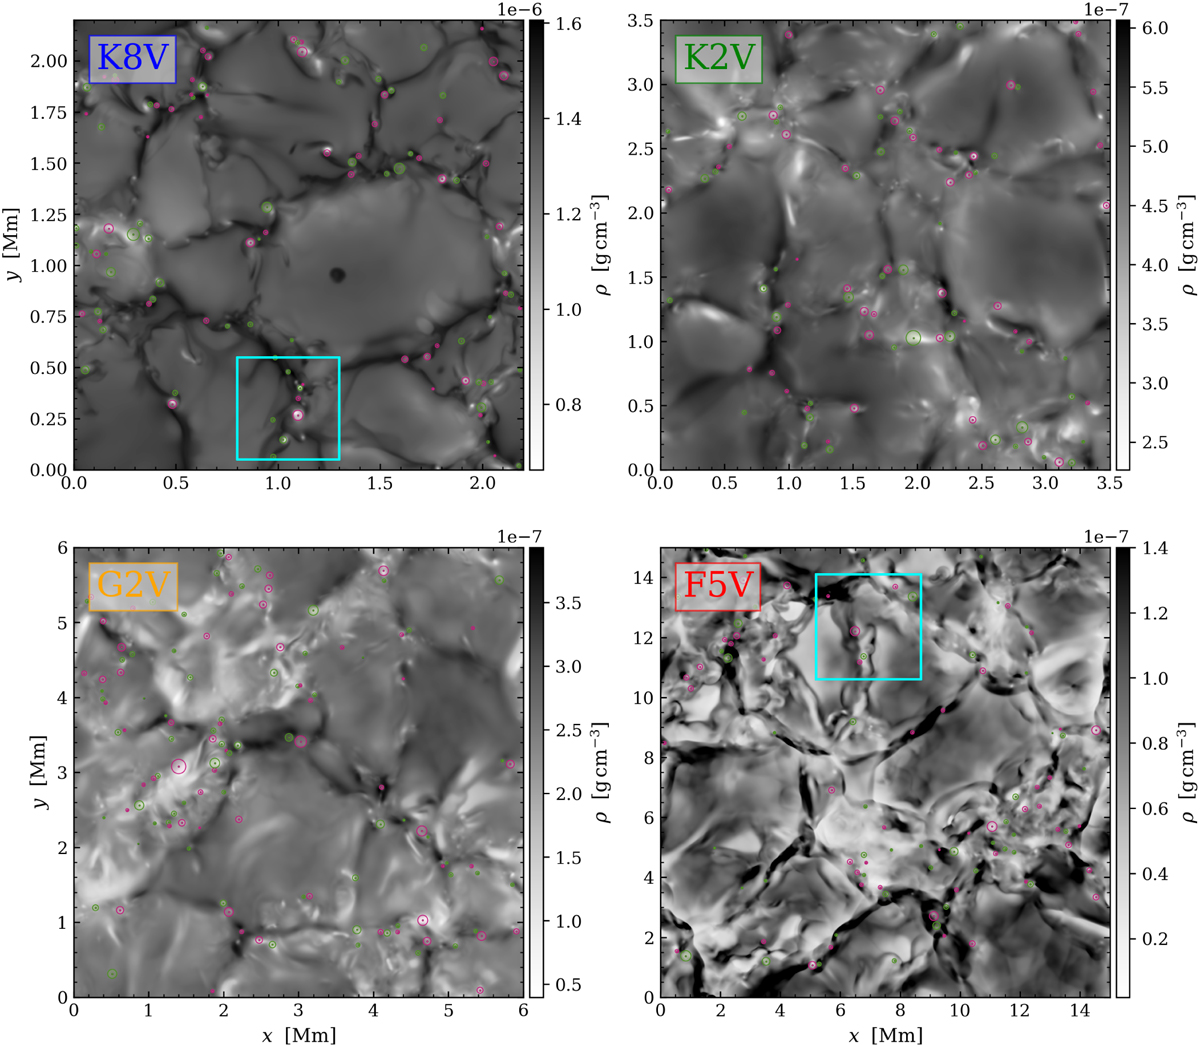
Density ρ at the average τR = 1 surface for the K8V, K2V, G2V, and F5V models during the kinematic phase. Pink and green disks correspond to the clockwise and counter-clockwise vortices identified by the SWIRL algorithm. The blue squares in the K8V and F5V panels represent the boundaries of the zoom-in plots shown in Fig. A.2.
Current usage metrics show cumulative count of Article Views (full-text article views including HTML views, PDF and ePub downloads, according to the available data) and Abstracts Views on Vision4Press platform.
Data correspond to usage on the plateform after 2015. The current usage metrics is available 48-96 hours after online publication and is updated daily on week days.
Initial download of the metrics may take a while.