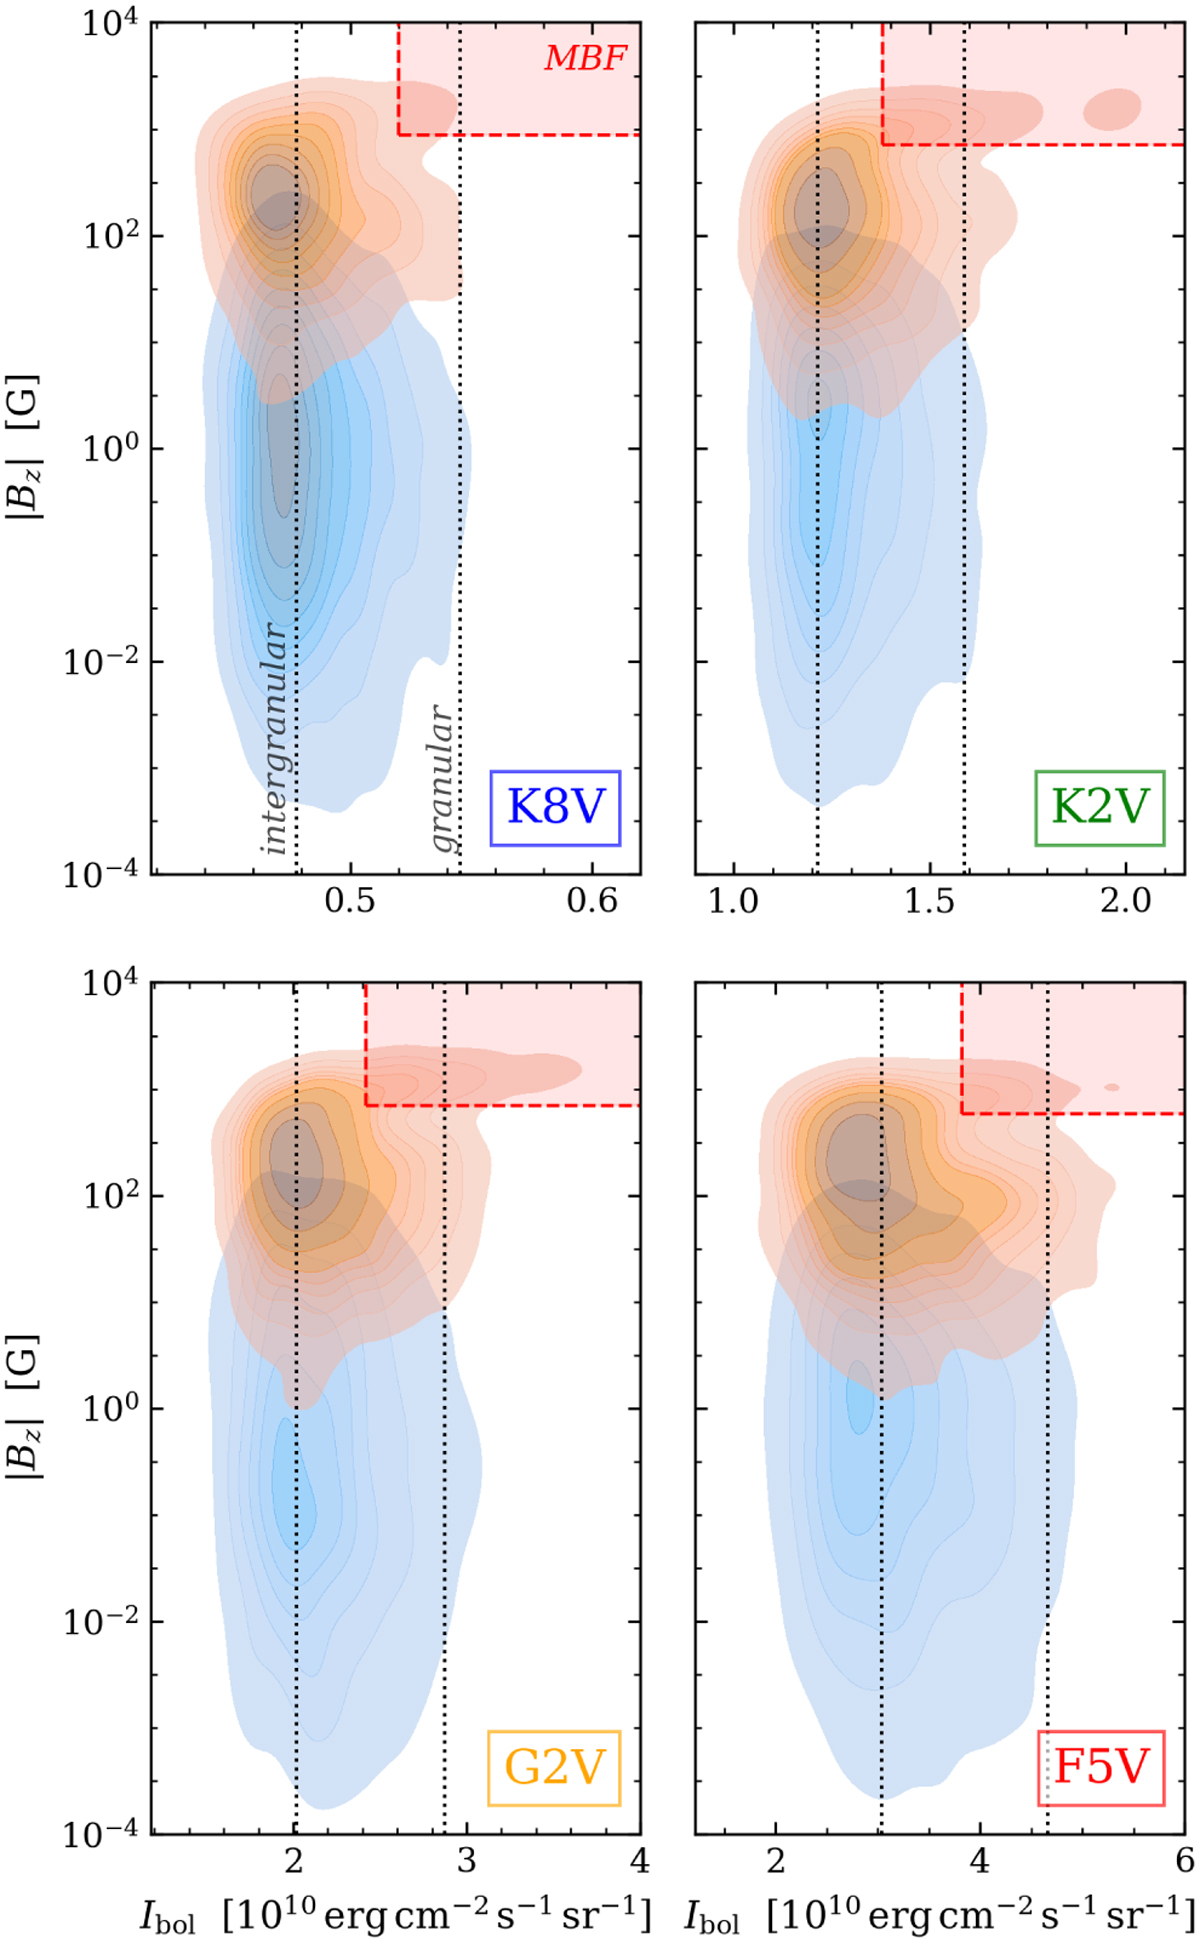
Fig. 3
Download original image
Bivariate distribution of the bolometric intensity Ibol and the absolute vertical magnetic field |Bz| in the center of the swirls identified on the surface layer at z = 0 km of the four stellar models. The distributions during the kinematic and saturation phases are shown in blue and orange, respectively. The vertical black dotted lines indicate the mean bolometric intensity in the intergranular (lower value) and granular (higher value) regions. The red shaded area indicates the identification range of magnetic bright feature (MBF) as defined by Riva et al. (2024).
Current usage metrics show cumulative count of Article Views (full-text article views including HTML views, PDF and ePub downloads, according to the available data) and Abstracts Views on Vision4Press platform.
Data correspond to usage on the plateform after 2015. The current usage metrics is available 48-96 hours after online publication and is updated daily on week days.
Initial download of the metrics may take a while.