Fig. 9.
Download original image
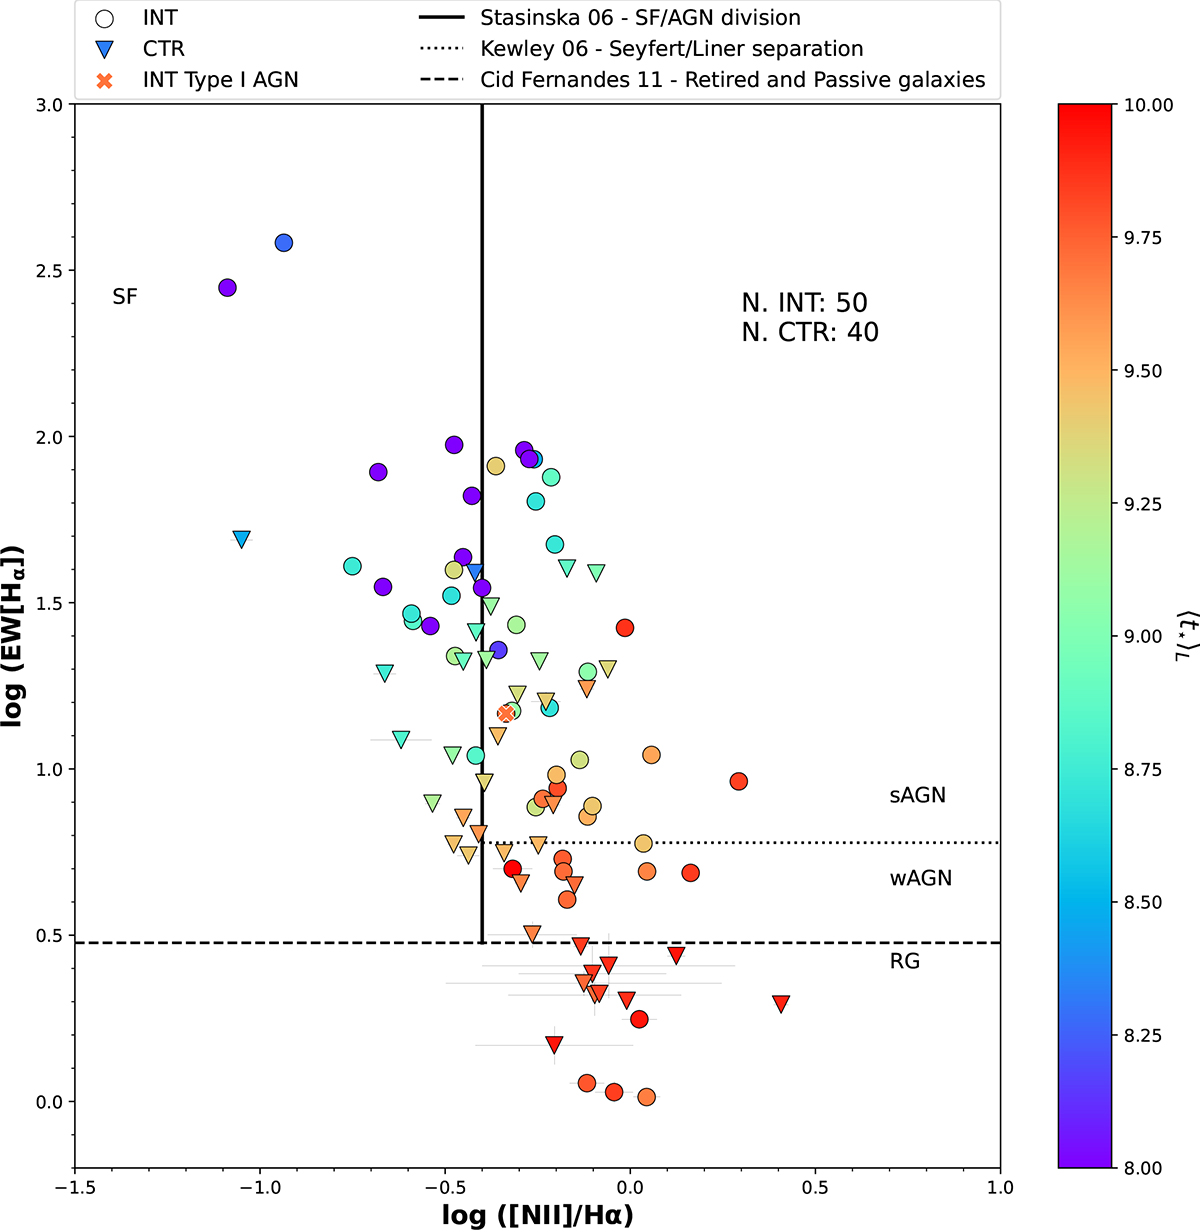
Diagram of [NII]/Hα versus the equivalent width of Hα (WHAN diagram, Cid Fernandes et al. 2010, 2011). INT galaxies are shown as circles, and CTR galaxies are shown as triangles. Symbol colors indicate the light-weighted mean ages of the stellar populations, showing the youngest mean ages in the star-forming galaxies and the oldest in the retired galaxies. Lines represent the divisions applied in this work to obtain the sources of ionization (Stasińska et al. 2006; Kewley et al. 2006; Cid Fernandes et al. 2011). The cross marks the position on the diagram of the only type I AGN found in the INT sample.
Current usage metrics show cumulative count of Article Views (full-text article views including HTML views, PDF and ePub downloads, according to the available data) and Abstracts Views on Vision4Press platform.
Data correspond to usage on the plateform after 2015. The current usage metrics is available 48-96 hours after online publication and is updated daily on week days.
Initial download of the metrics may take a while.