Fig. 8.
Download original image
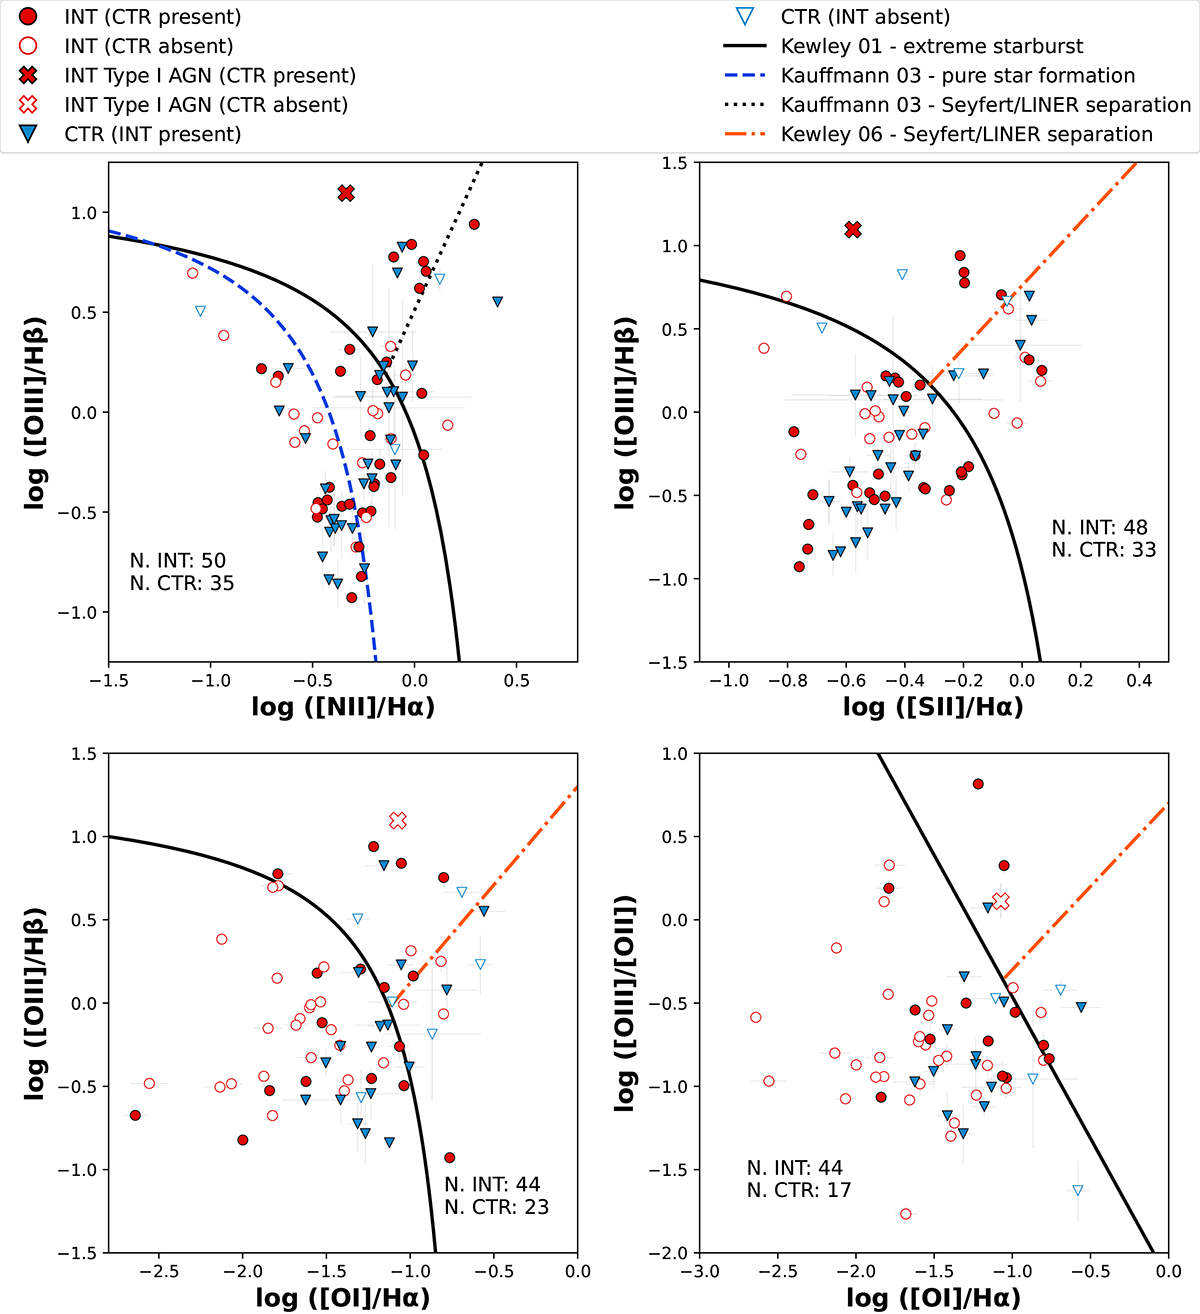
Emission-line diagnostic diagrams used to compare the ionization mechanisms of the INT galaxies (red points) and the CTR sample (blue triangles). Filled symbols correspond to INT (CTR) galaxies whose corresponding CTR (INT) galaxy is also included on that diagram, and open symbols when it is not. Lines in the diagrams represent the theoretical (Kewley et al. 2001) and empirical (Kauffmann et al. 2003; Kewley et al. 2006) divisions applied in this work to classify the ionization sources. Each diagram shows the number of sources included in each diagram. The red cross marks the position on the diagrams of the only type I AGN found in the INT sample.
Current usage metrics show cumulative count of Article Views (full-text article views including HTML views, PDF and ePub downloads, according to the available data) and Abstracts Views on Vision4Press platform.
Data correspond to usage on the plateform after 2015. The current usage metrics is available 48-96 hours after online publication and is updated daily on week days.
Initial download of the metrics may take a while.