Fig. 7.
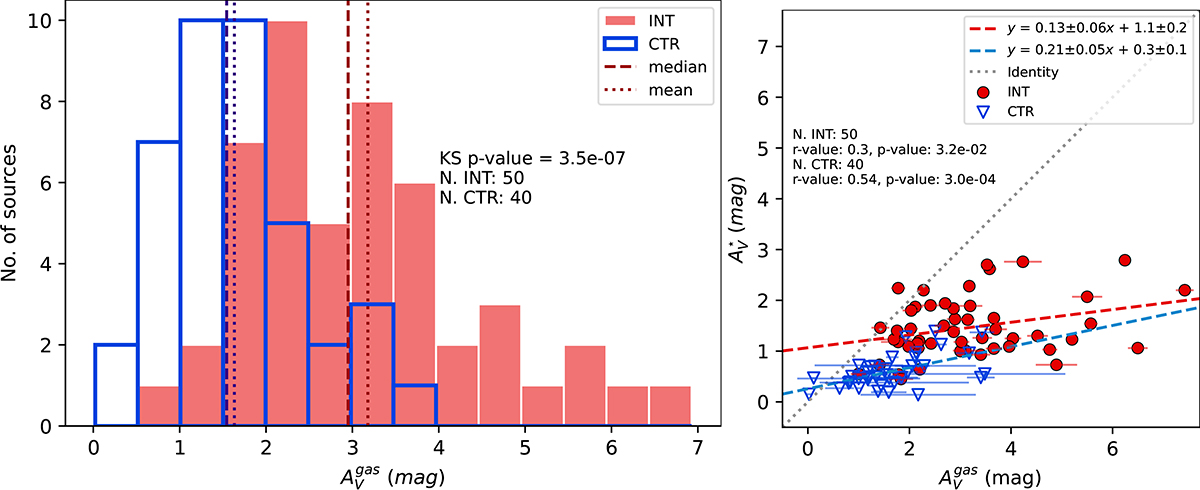
Download original image
Left panel: Histogram of the gas extinction obtained via Balmer decrement for the INT (in red) and CTR sample galaxies (in blue). The mean and median values of both samples as in Fig. 11. Right panel: Relation between stellar extinction (![]() ) and nebular extinction (
) and nebular extinction (![]() ) for the INT (red circles) and CTR (blue triangles) samples. Dashed lines show the best linear regression fit obtained in both cases. The linear equations, Pearson correlation coefficients (r-value), and p-values of the fits are indicated in the inset. The dotted gray line corresponds to the case in which
) for the INT (red circles) and CTR (blue triangles) samples. Dashed lines show the best linear regression fit obtained in both cases. The linear equations, Pearson correlation coefficients (r-value), and p-values of the fits are indicated in the inset. The dotted gray line corresponds to the case in which ![]() =
= ![]() .
.
Current usage metrics show cumulative count of Article Views (full-text article views including HTML views, PDF and ePub downloads, according to the available data) and Abstracts Views on Vision4Press platform.
Data correspond to usage on the plateform after 2015. The current usage metrics is available 48-96 hours after online publication and is updated daily on week days.
Initial download of the metrics may take a while.