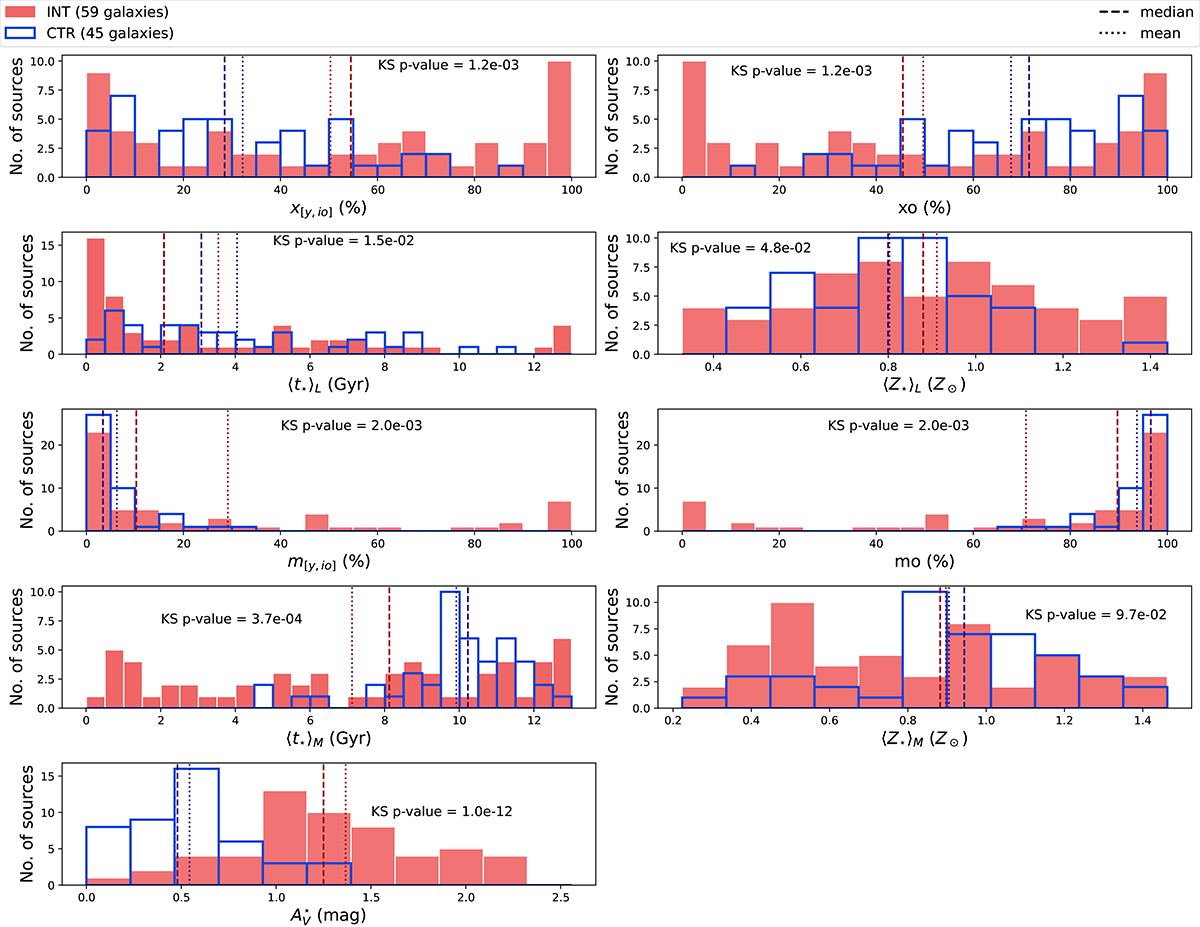
Fig. 6.
Download original image
Histograms of the stellar population synthesis modeling for INT (filled red bars) and CTR (full blue lines) samples. The histograms also show the mean (dotted vertical lines) and median (dashed vertical lines) values for both samples and the KS test p-value. The first two rows of histograms present the light-weighted properties. They present the sum of light fractions younger than 2 Gyr (x[y, io] = xy+xiy+xio), the light fractions in the older stellar populations (xo), the light-weighted mean ages, and mean metallicities. The following two rows present the mass-weighted results of the same properties. The lower right histogram shows the stellar extinction of the samples.
Current usage metrics show cumulative count of Article Views (full-text article views including HTML views, PDF and ePub downloads, according to the available data) and Abstracts Views on Vision4Press platform.
Data correspond to usage on the plateform after 2015. The current usage metrics is available 48-96 hours after online publication and is updated daily on week days.
Initial download of the metrics may take a while.