Open Access
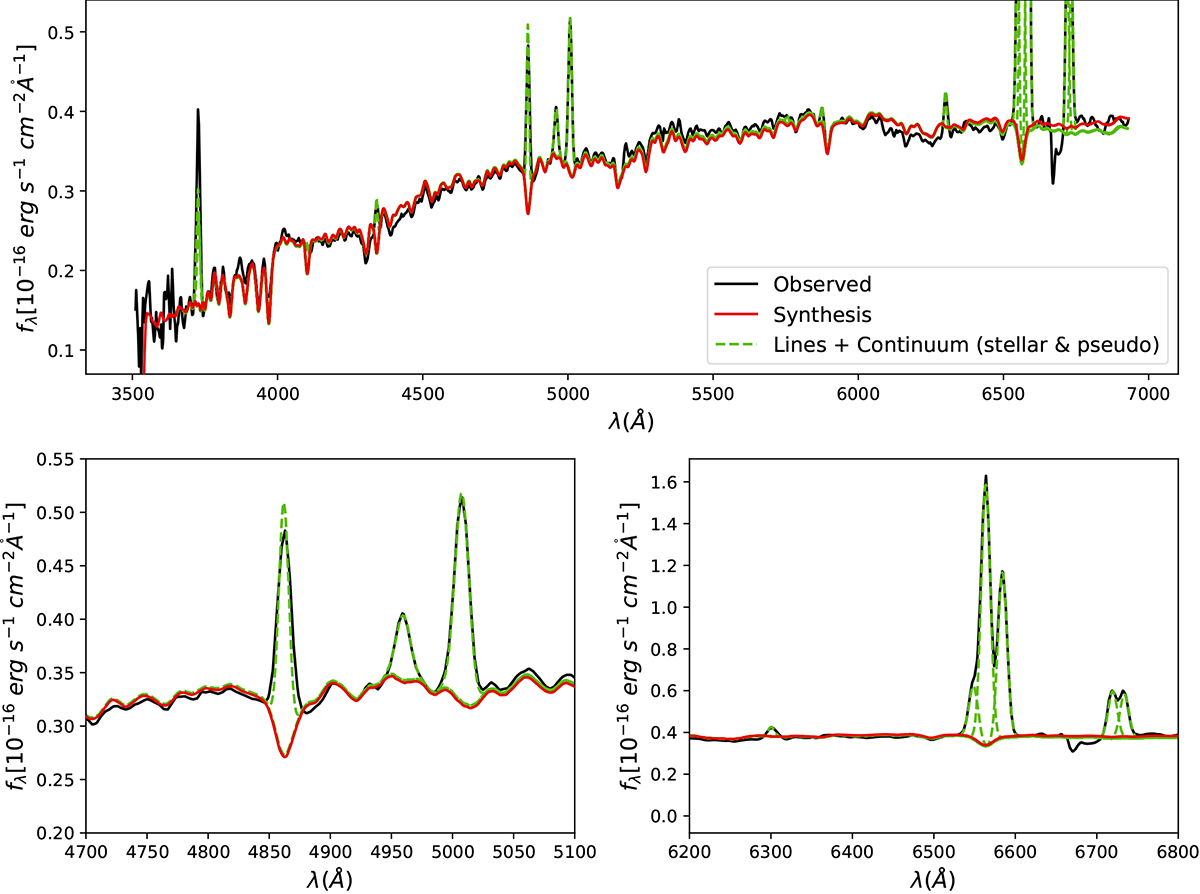
Fig. 5.
Download original image
Example of stellar population synthesis and emission line fitting for the galaxy AM 22217–490 G1. The modeled emission lines can be seen as dashed green lines and the stellar synthesis as a red line. The bottom left and right panels correspond to the spectral regions around Hβ and Hα, respectively.
Current usage metrics show cumulative count of Article Views (full-text article views including HTML views, PDF and ePub downloads, according to the available data) and Abstracts Views on Vision4Press platform.
Data correspond to usage on the plateform after 2015. The current usage metrics is available 48-96 hours after online publication and is updated daily on week days.
Initial download of the metrics may take a while.