Fig. 4.
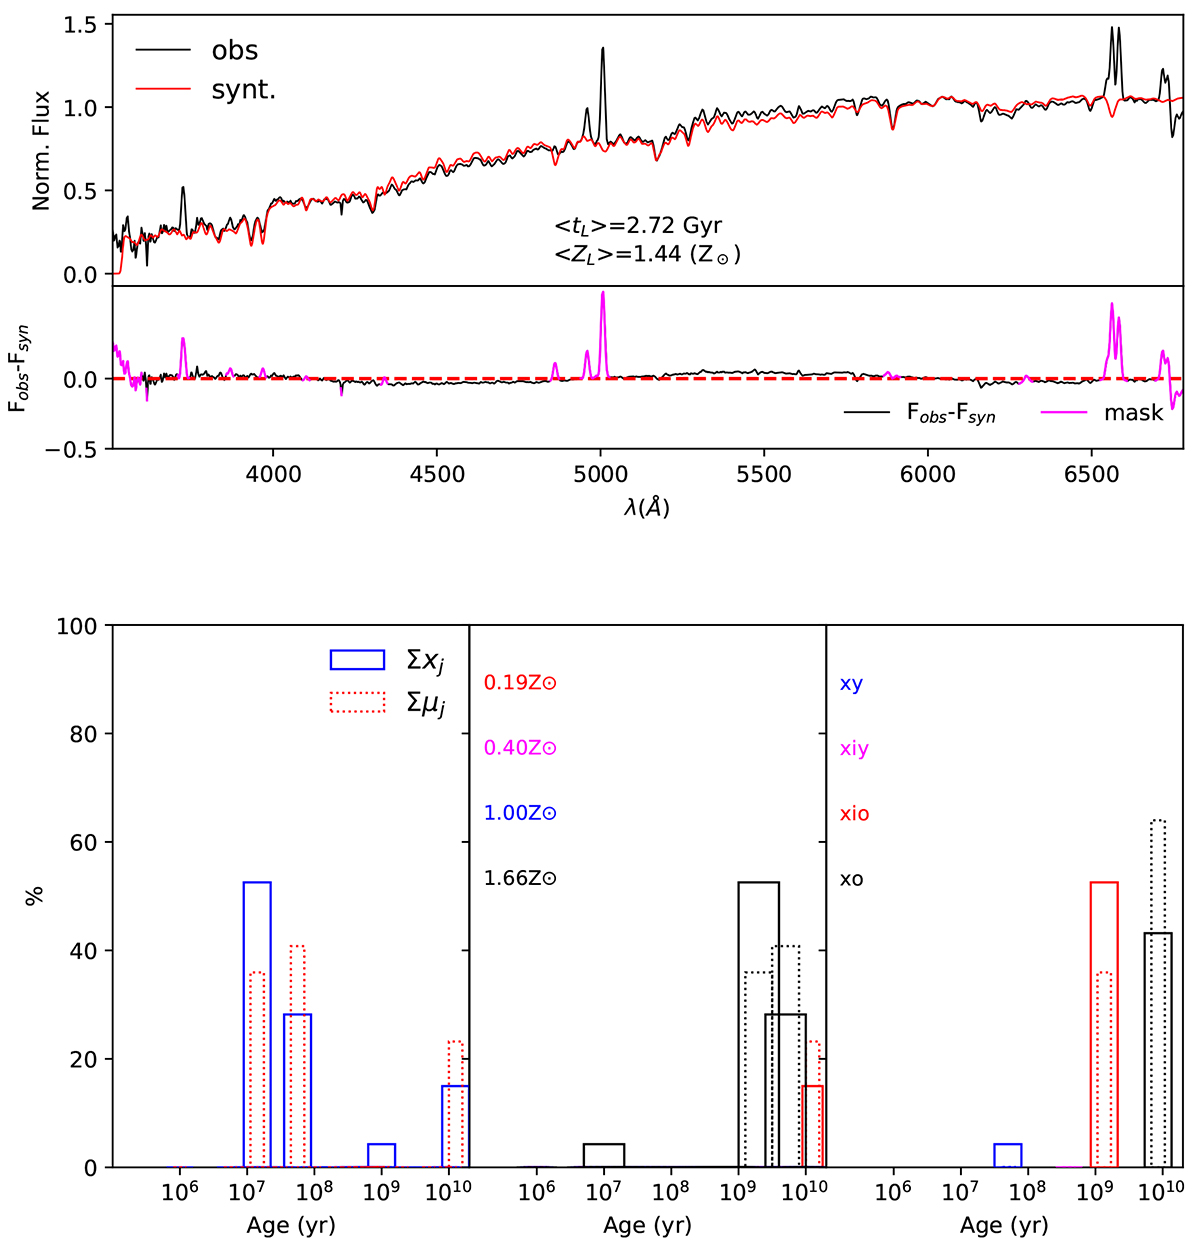
Download original image
Example of stellar population synthesis of AM 1933–422 B. Top panel: Observed and stellar population synthesis fitting (black and red lines, respectively). The inset at the bottom shows the pure emission line spectra (magenta line). Bottom panel: The left histogram shows, in bins of age, the stellar population contribution in light (solid line) and mass (dashed line) fractions. The middle histogram presents, in bins of age, the metallicity of the fitted stellar populations. The right histogram shows the population vectors in light (solid line) and mass (dashed line) fractions.
Current usage metrics show cumulative count of Article Views (full-text article views including HTML views, PDF and ePub downloads, according to the available data) and Abstracts Views on Vision4Press platform.
Data correspond to usage on the plateform after 2015. The current usage metrics is available 48-96 hours after online publication and is updated daily on week days.
Initial download of the metrics may take a while.