Open Access
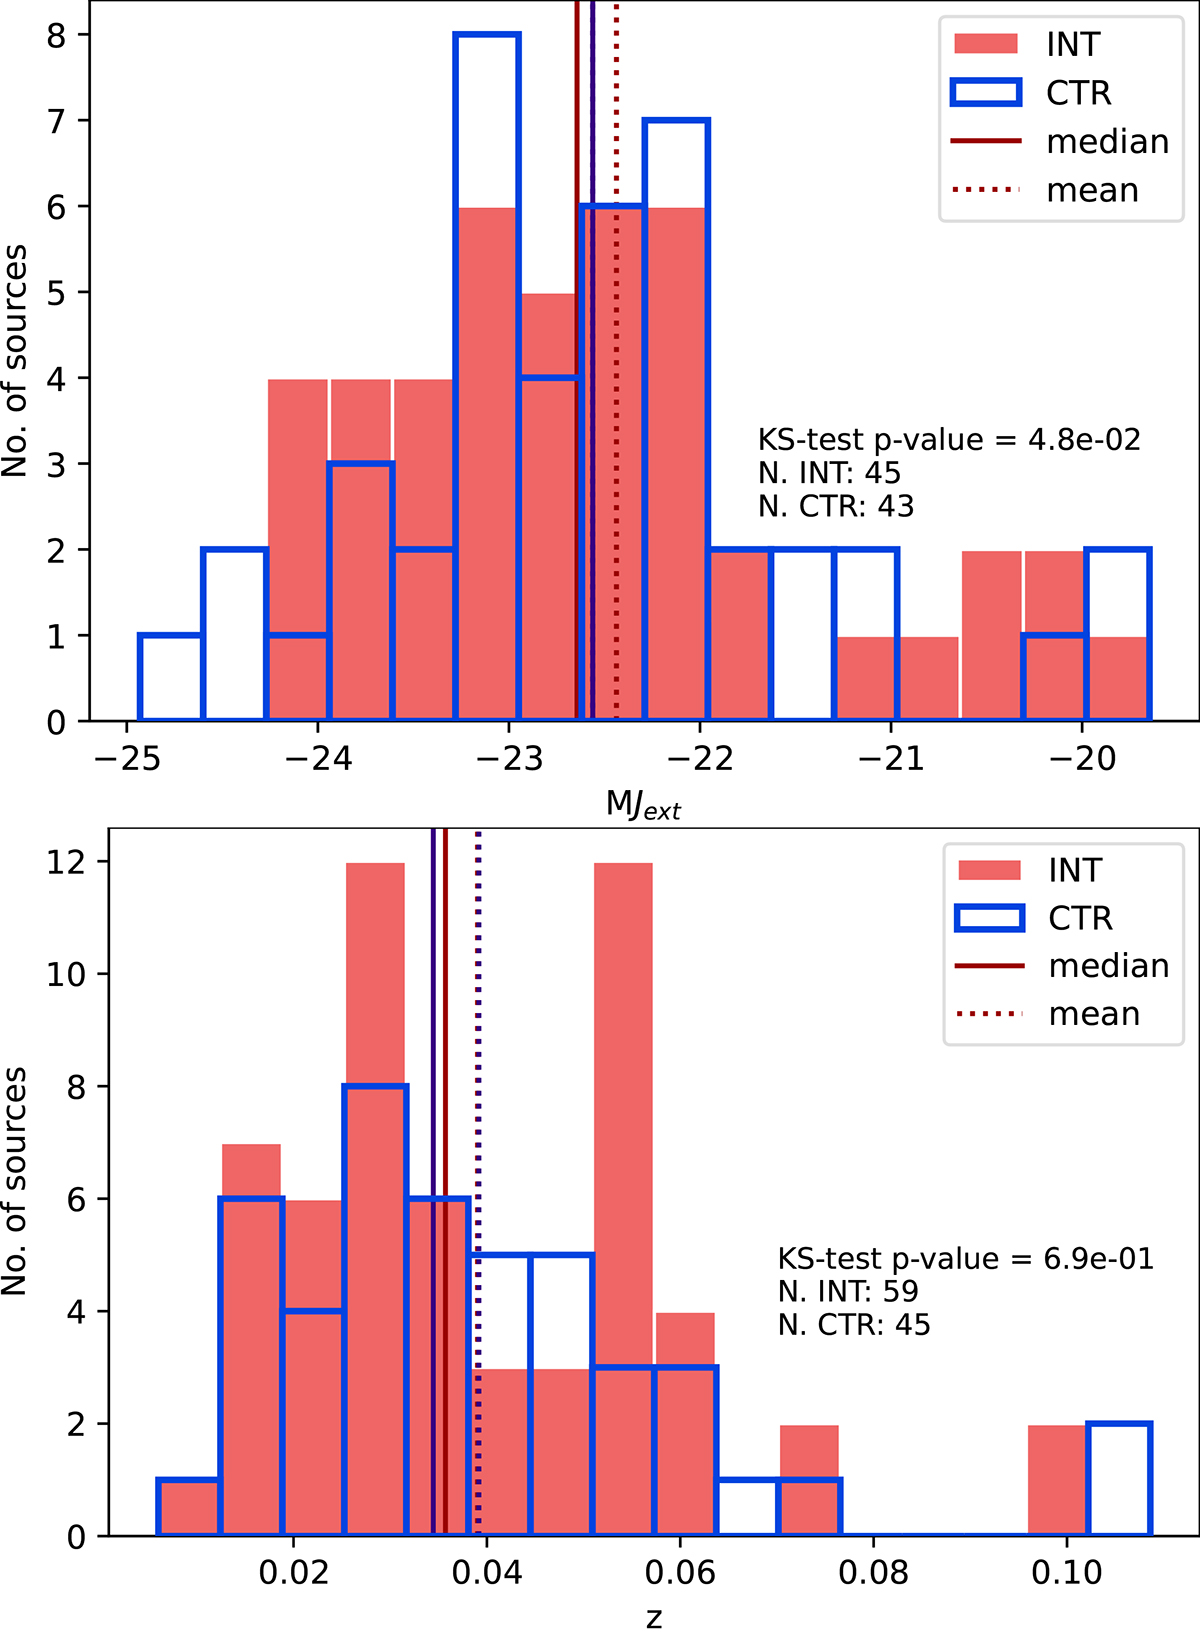
Fig. 3.
Download original image
Distribution of absolute magnitudes (using the available extended Jext 2MASS magnitudes) and redshifts for INT (red filled histograms) and CTR (blue continuous line) samples. The plot also shows the samples median, mean values, and their KS test p-values.
Current usage metrics show cumulative count of Article Views (full-text article views including HTML views, PDF and ePub downloads, according to the available data) and Abstracts Views on Vision4Press platform.
Data correspond to usage on the plateform after 2015. The current usage metrics is available 48-96 hours after online publication and is updated daily on week days.
Initial download of the metrics may take a while.