Open Access
Fig. 2.
Download original image
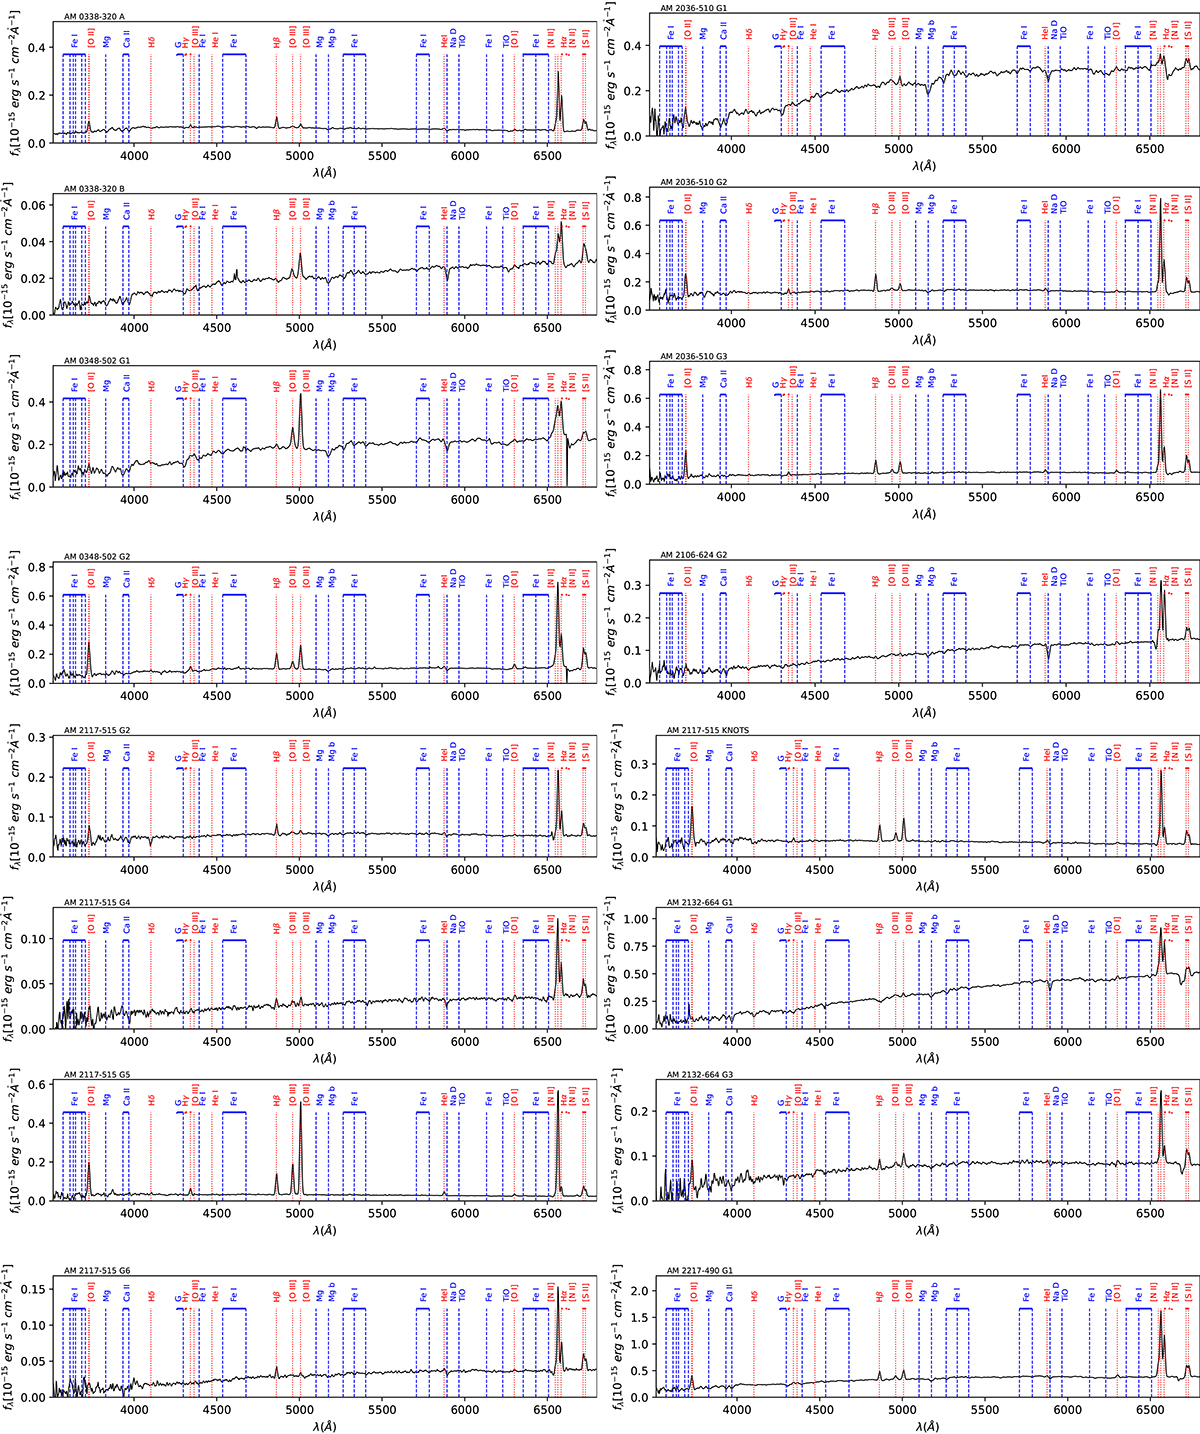
Examples of nuclear rest-frame spectra (2.2 kpc aperture) of the interacting pairs observed with GMOS-S. The main emission lines and absorption features are indicated as vertical red and blue lines, respectively. The remaining spectra are shown in Fig. A.2 in Appendix https://zenodo.org/records/12528027.
Current usage metrics show cumulative count of Article Views (full-text article views including HTML views, PDF and ePub downloads, according to the available data) and Abstracts Views on Vision4Press platform.
Data correspond to usage on the plateform after 2015. The current usage metrics is available 48-96 hours after online publication and is updated daily on week days.
Initial download of the metrics may take a while.