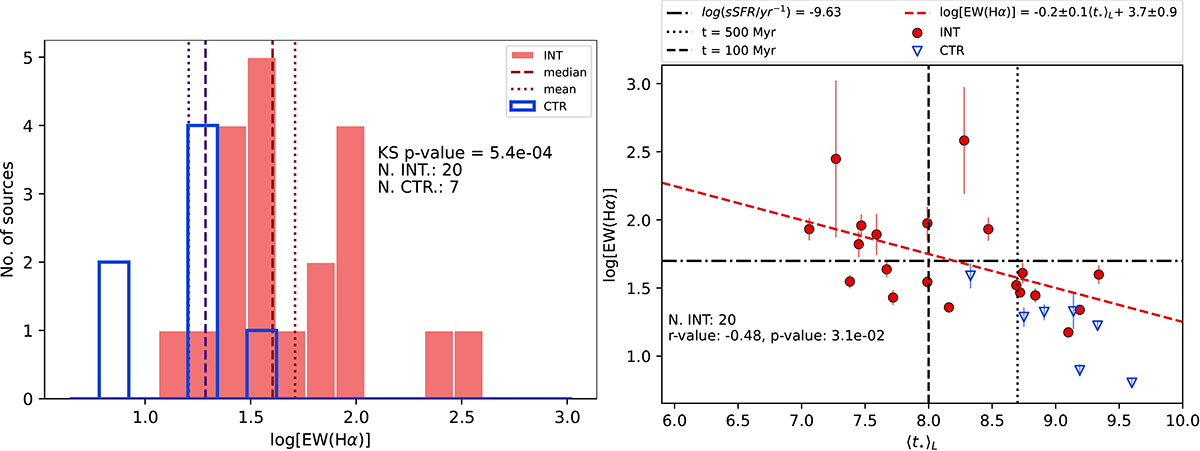
Fig. 11.
Download original image
Left panel: Distribution of EW(Hα) for the bona fide SF galaxies. Right panel: Relation between light-weighted mean ages, ⟨t*⟩L, and Hα, equivalent width, for SF galaxies. SF INT galaxies are shown as red circles, and SF CTRs as blue triangles. The dashed red line corresponds to the linear regression fit obtained for the SF INT galaxies. The linear equation, Pearson correlation coefficient (r-value), and p-value of the fit are provided in the inset. The dashed and dotted black lines indicate the mean stellar ages of 100 Myr and 500 Myr, respectively. The dash-dotted line indicates EW(Hα) = 50 Å or log(sSFR/yr−1) = −9.63.
Current usage metrics show cumulative count of Article Views (full-text article views including HTML views, PDF and ePub downloads, according to the available data) and Abstracts Views on Vision4Press platform.
Data correspond to usage on the plateform after 2015. The current usage metrics is available 48-96 hours after online publication and is updated daily on week days.
Initial download of the metrics may take a while.