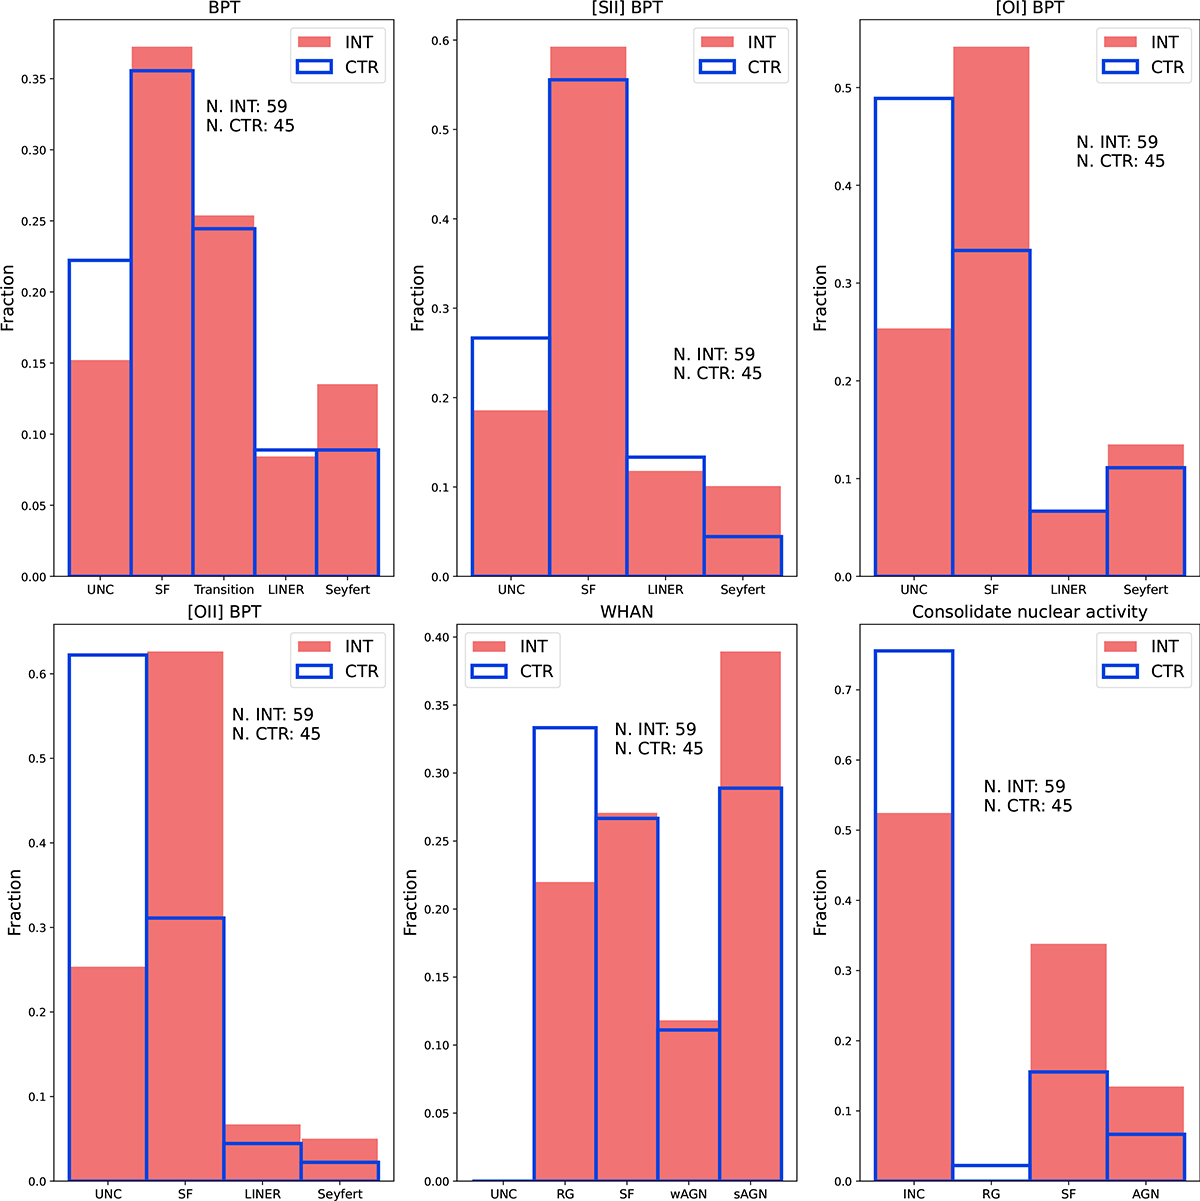
Fig. 10.
Download original image
Histograms of the dominant gas ionization mechanisms found from each diagnostic diagram. The three top and the bottom left histograms show the fractions of galaxies classified from the BPT diagrams as SF, AGN (LINER or Seyfert), and composite ([NII] BPT). For the WHAN diagram, the galaxies are classified as retired (RG), SF, strong-AGN (sAGN), and weak-AGN (wAGN). Galaxies that could not be classified in a particular diagram are shown in the histograms as unclassified. The bottom right histogram summarizes the information obtained from all the diagrams, which we divided into four categories: SF, AGN, RG, and inconclusive (INC). Galaxies included in the SF, AGN, and RG groups are those that have the same classification in at least four of the five BPT and WHAN diagrams.
Current usage metrics show cumulative count of Article Views (full-text article views including HTML views, PDF and ePub downloads, according to the available data) and Abstracts Views on Vision4Press platform.
Data correspond to usage on the plateform after 2015. The current usage metrics is available 48-96 hours after online publication and is updated daily on week days.
Initial download of the metrics may take a while.