Fig. 5
Download original image
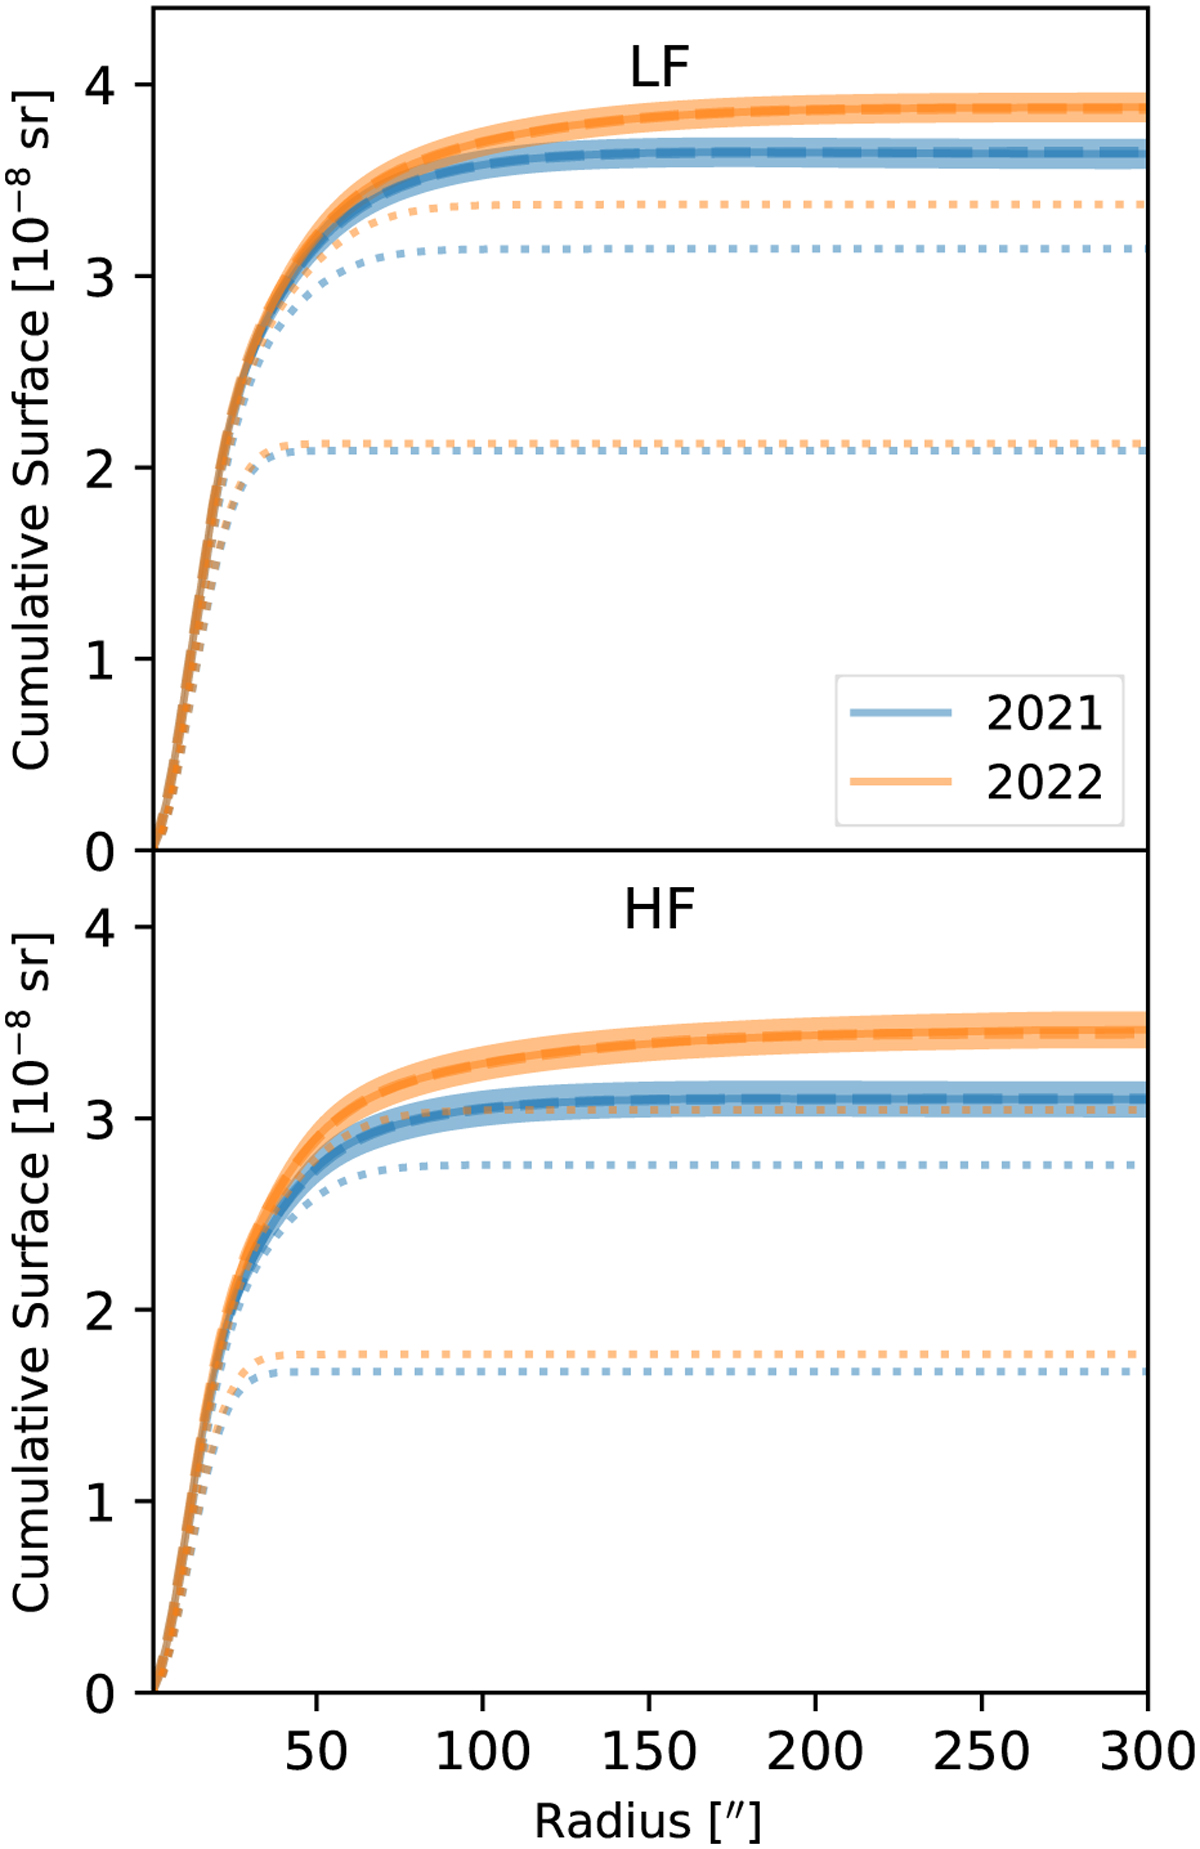
Cumulative radial profiles of the CONCERTO beam for the low-frequency (top) and high-frequency (bottom) arrays during the 2021 and 2022 campaigns. These profiles were derived from the normalised combination of 13 and 15 beam-map scans on planets. The dashed line represents the best-fit profile model integrated with the radius. The dotted lines represent cumulatively each Gaussian component, the main beam (lowest) and the first error beam.
Current usage metrics show cumulative count of Article Views (full-text article views including HTML views, PDF and ePub downloads, according to the available data) and Abstracts Views on Vision4Press platform.
Data correspond to usage on the plateform after 2015. The current usage metrics is available 48-96 hours after online publication and is updated daily on week days.
Initial download of the metrics may take a while.