Fig. 3
Download original image
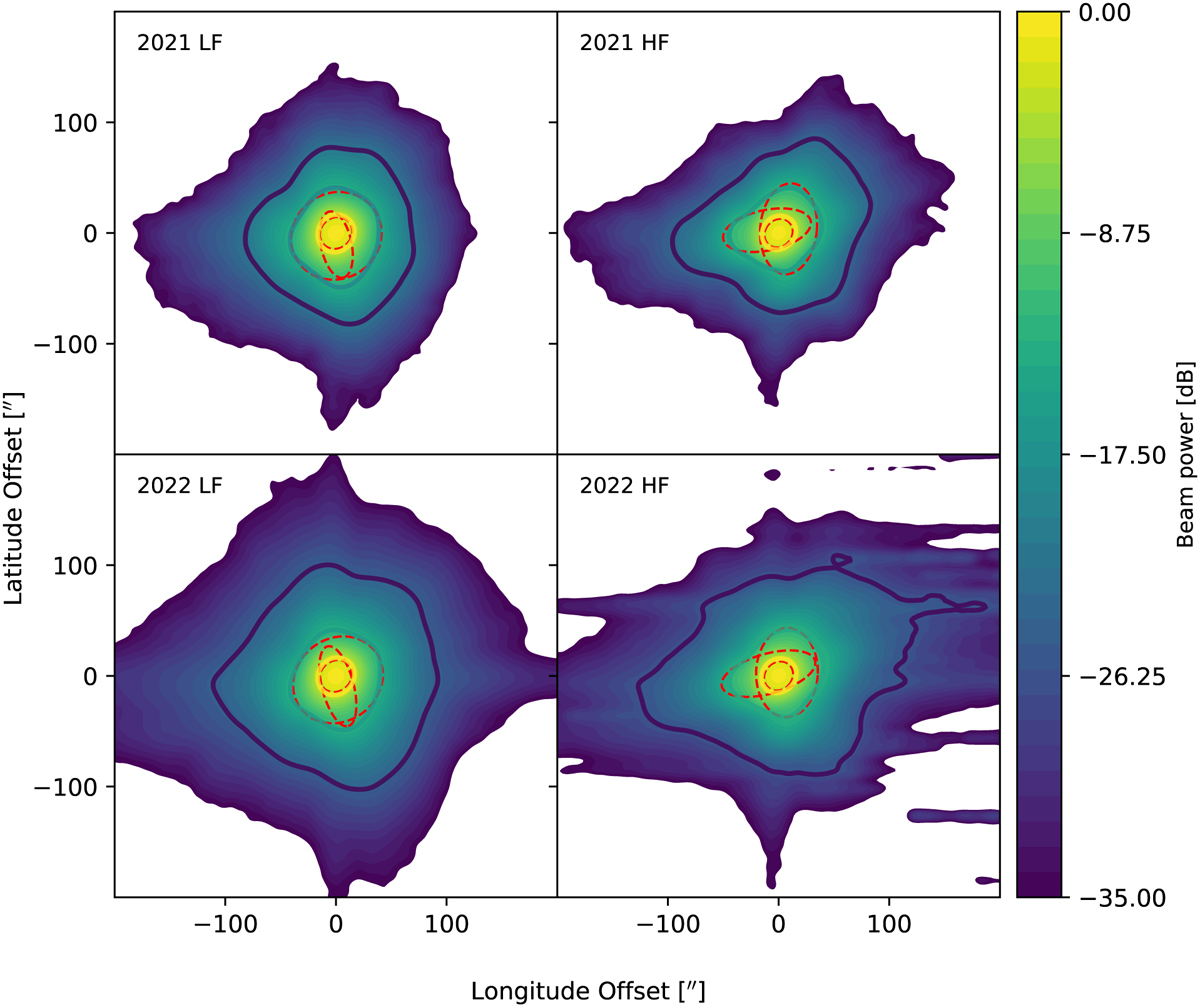
Horizontal average beam patterns of CONCERTO for the low-frequency (left) and high-frequency (right) arrays during the 2021 and 2022 campaigns. These maps were created by combining 13 and 15 beam-map scans on planets and normalising the results. The thin dashed red lines are the 2D Gaussian decomposition. The thick solid lines (yellow, green, and dark blue) depict the half-maximum contours of the main beam and the two error beams when decomposing it into three radial Gaussian functions. The horizontal and vertical extensions are due to the secondary quadrupod legs.
Current usage metrics show cumulative count of Article Views (full-text article views including HTML views, PDF and ePub downloads, according to the available data) and Abstracts Views on Vision4Press platform.
Data correspond to usage on the plateform after 2015. The current usage metrics is available 48-96 hours after online publication and is updated daily on week days.
Initial download of the metrics may take a while.