Fig. 15
Download original image
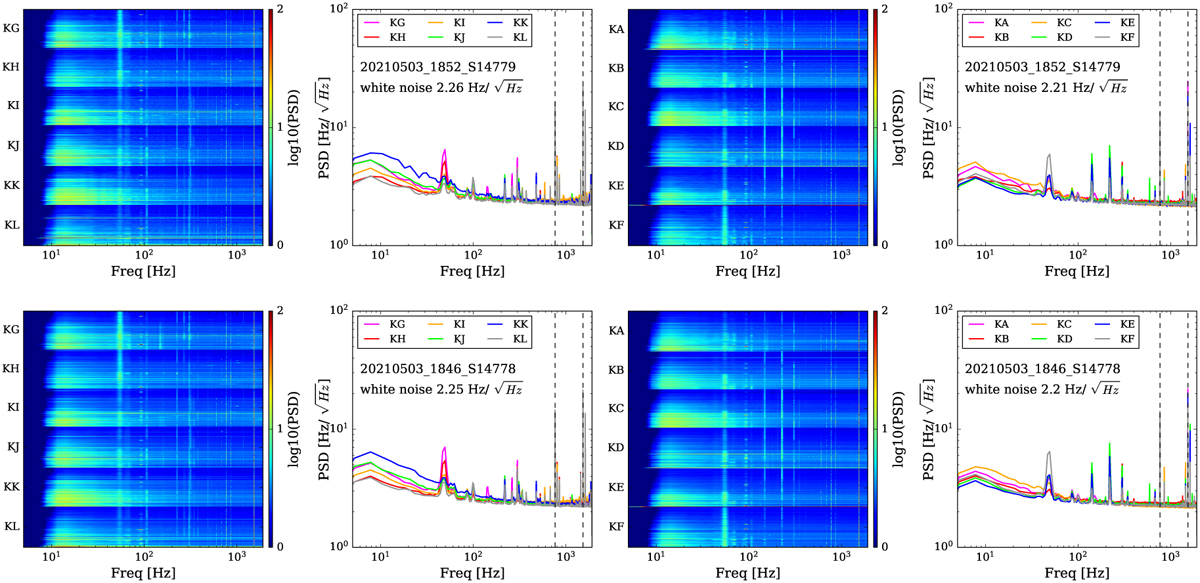
Noise power spectra of the CONCERTO data obtained in photometric mode (MPI OFF) with CAP ON. The odd and even columns show the noise power spectra densities for each LEKID and the median value of the corresponding LEKID array, respectively. A clear peak arises at ~50 Hz. The black dashed lines represent the peaks observed at 763 Hz and 1527 Hz in the study by Bourrion et al. (2022). All scans have similar noise power spectra and white noise of ![]() . The corresponding observing conditions for the two scans shown here are given in Table 5.
. The corresponding observing conditions for the two scans shown here are given in Table 5.
Current usage metrics show cumulative count of Article Views (full-text article views including HTML views, PDF and ePub downloads, according to the available data) and Abstracts Views on Vision4Press platform.
Data correspond to usage on the plateform after 2015. The current usage metrics is available 48-96 hours after online publication and is updated daily on week days.
Initial download of the metrics may take a while.