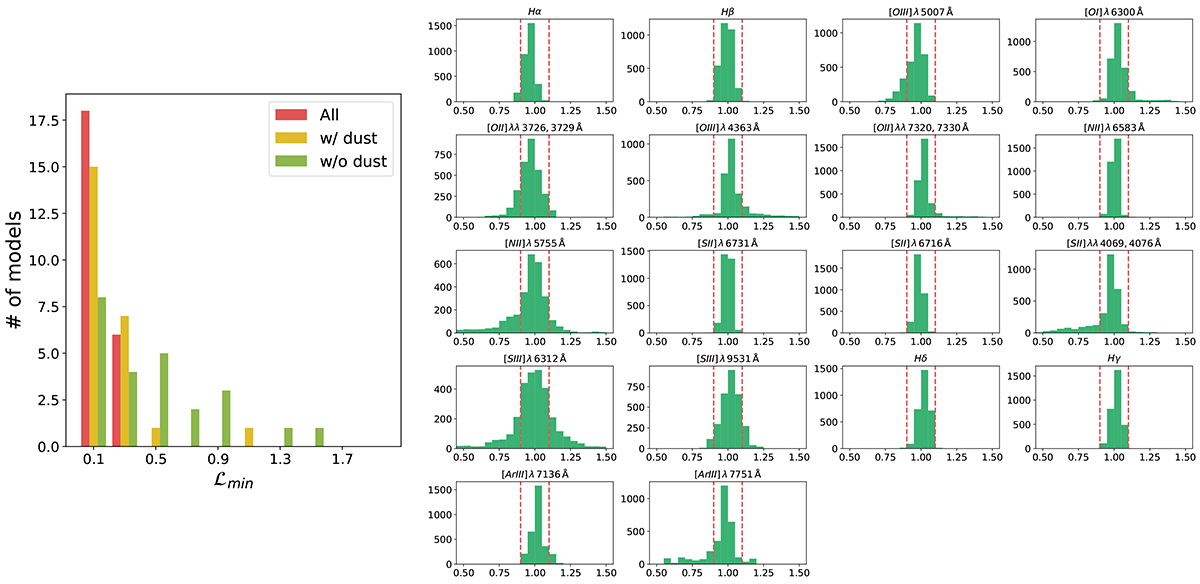
Fig. 8.
Download original image
Model fit of the HII regions from the CHAOS sample. Left: distribution of ℒ values for the best or acceptable models of the HII regions from the CHAOS sample. Right: distributions of the contributions to ℒ from each of the lines used for model fitting. The adopted error on the line fluxes is the maximum between the observed error and 10%.
Current usage metrics show cumulative count of Article Views (full-text article views including HTML views, PDF and ePub downloads, according to the available data) and Abstracts Views on Vision4Press platform.
Data correspond to usage on the plateform after 2015. The current usage metrics is available 48-96 hours after online publication and is updated daily on week days.
Initial download of the metrics may take a while.