Fig. 7.
Download original image
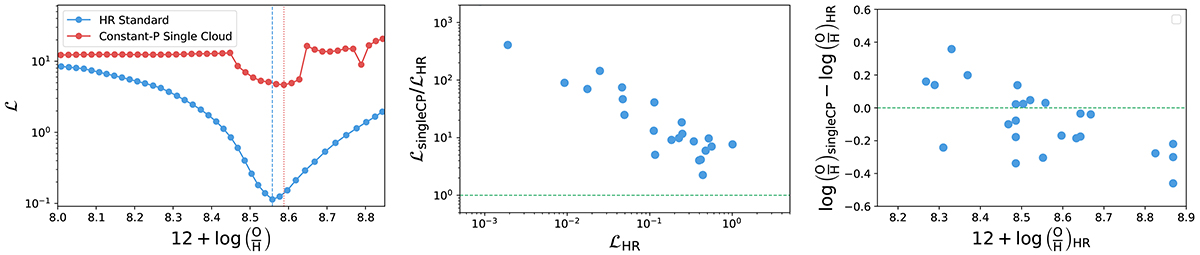
Comparison of HOMERUN with single-cloud constant-pressure models. Left: variation of the loss function ℒ as a function of metallicity for the emission line spectrum of the test HII region. The blue line with dots represents the HOMERUN model presented here (standard model), while the red line with dots represents the case of constant pressure single-cloud models (Constant-P single cloud). The vertical red and blue dashed lines represent the metallicity of the models with the minimum value of the loss function ℒ. Middle: ratios of ℒ minimum values from Constant-P single-cloud and HOMERUN standard models. Right: Variation of abundances of Constant-P single-cloud models with respect to HOMERUN standard models.
Current usage metrics show cumulative count of Article Views (full-text article views including HTML views, PDF and ePub downloads, according to the available data) and Abstracts Views on Vision4Press platform.
Data correspond to usage on the plateform after 2015. The current usage metrics is available 48-96 hours after online publication and is updated daily on week days.
Initial download of the metrics may take a while.