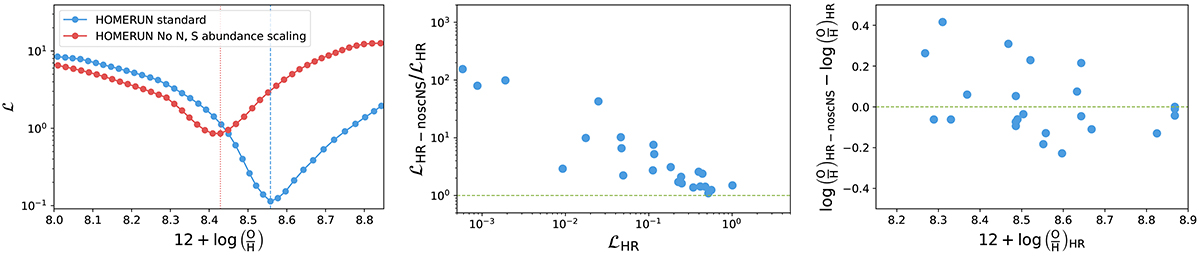
Fig. 6.
Download original image
Effect of rescaling N/O and S/O relative abundances with respect to the values used in photoionization calculations. Left: variation of the loss function ℒ as a function of metallicity when fitting the emission line spectrum of the test HII region in Figure 1. The blue line with dots represents the HOMERUN model with N and S rescaling (standard model), while the red line with dots represents the same model but without rescaling (i.e., no N,S abundance scaling). We note that the minimum value of the loss function when excluding rescaling (represented by the dotted red line) is around ten times higher than that for the standard model (represented by the dotted blue line). The vertical red dashed line represents the metallicity of the models with the minimum value of the loss function ℒ. Middle: ratios of ℒ minimum values from models with no N,S abundance scaling and standard models when applied to the HII regions of the Zurita et al. (2021) sample. The effect of non-rescaling N and S is to increase the minimum ℒ value by up to a factor 100. Right: variation of abundances of models with no N,S abundance scaling with respect to standard models compared to the abundances of standard models.
Current usage metrics show cumulative count of Article Views (full-text article views including HTML views, PDF and ePub downloads, according to the available data) and Abstracts Views on Vision4Press platform.
Data correspond to usage on the plateform after 2015. The current usage metrics is available 48-96 hours after online publication and is updated daily on week days.
Initial download of the metrics may take a while.