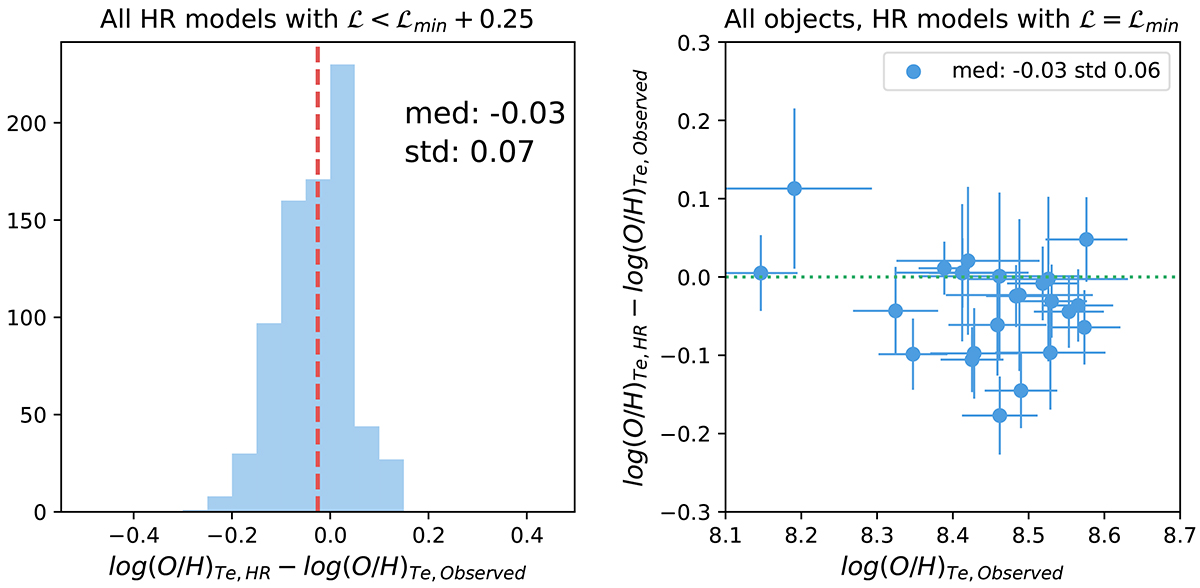
Fig. 4.
Download original image
Comparison between the oxygen abundances derived with the Te method using observed and HOMERUN model line fluxes from the selected HII regions from the sample of Zurita et al. (2021). In the left panel, we consider, for all sources, all the models with ℒ < ℒmin + 0.25; the vertical dashed line represents the median of the distribution. In the right panel, we consider only the models with ℒ = ℒmin.
Current usage metrics show cumulative count of Article Views (full-text article views including HTML views, PDF and ePub downloads, according to the available data) and Abstracts Views on Vision4Press platform.
Data correspond to usage on the plateform after 2015. The current usage metrics is available 48-96 hours after online publication and is updated daily on week days.
Initial download of the metrics may take a while.