Fig. 3.
Download original image
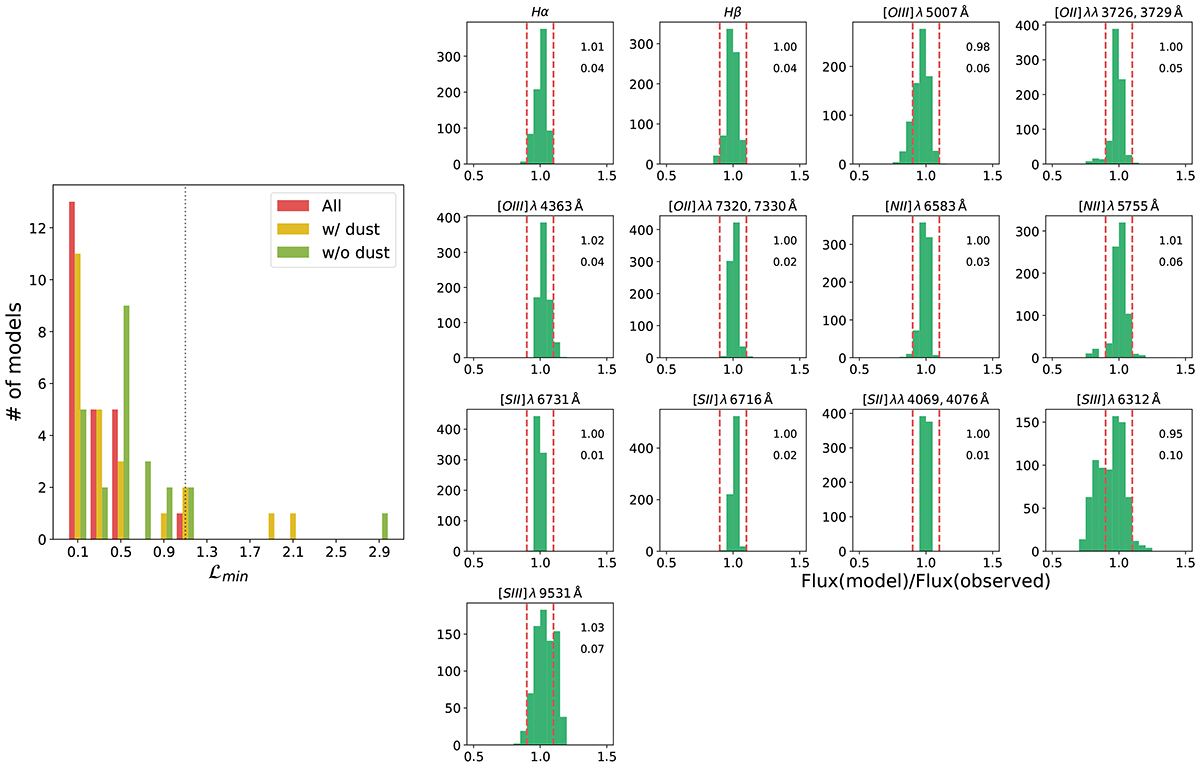
Model fit of the HII regions from the Zurita et al. (2021) sample. Left: distribution of ℒmin values for the subsample of HII regions selected from Zurita et al. (2021). Right: distributions of the ratios between the model and observed line fluxes for all the selected HII regions and all the models with ℒ ≤ ℒmin + 0.25. The numbers in the top-right corner of the panels represent, from top to bottom, the median and standard deviation of the distribution of ℒ values. The vertical dashed lines represent the ±10% discrepancy and show how the large majority of models reproduce all lines within ±10% of the observed values.
Current usage metrics show cumulative count of Article Views (full-text article views including HTML views, PDF and ePub downloads, according to the available data) and Abstracts Views on Vision4Press platform.
Data correspond to usage on the plateform after 2015. The current usage metrics is available 48-96 hours after online publication and is updated daily on week days.
Initial download of the metrics may take a while.