Fig. 2.
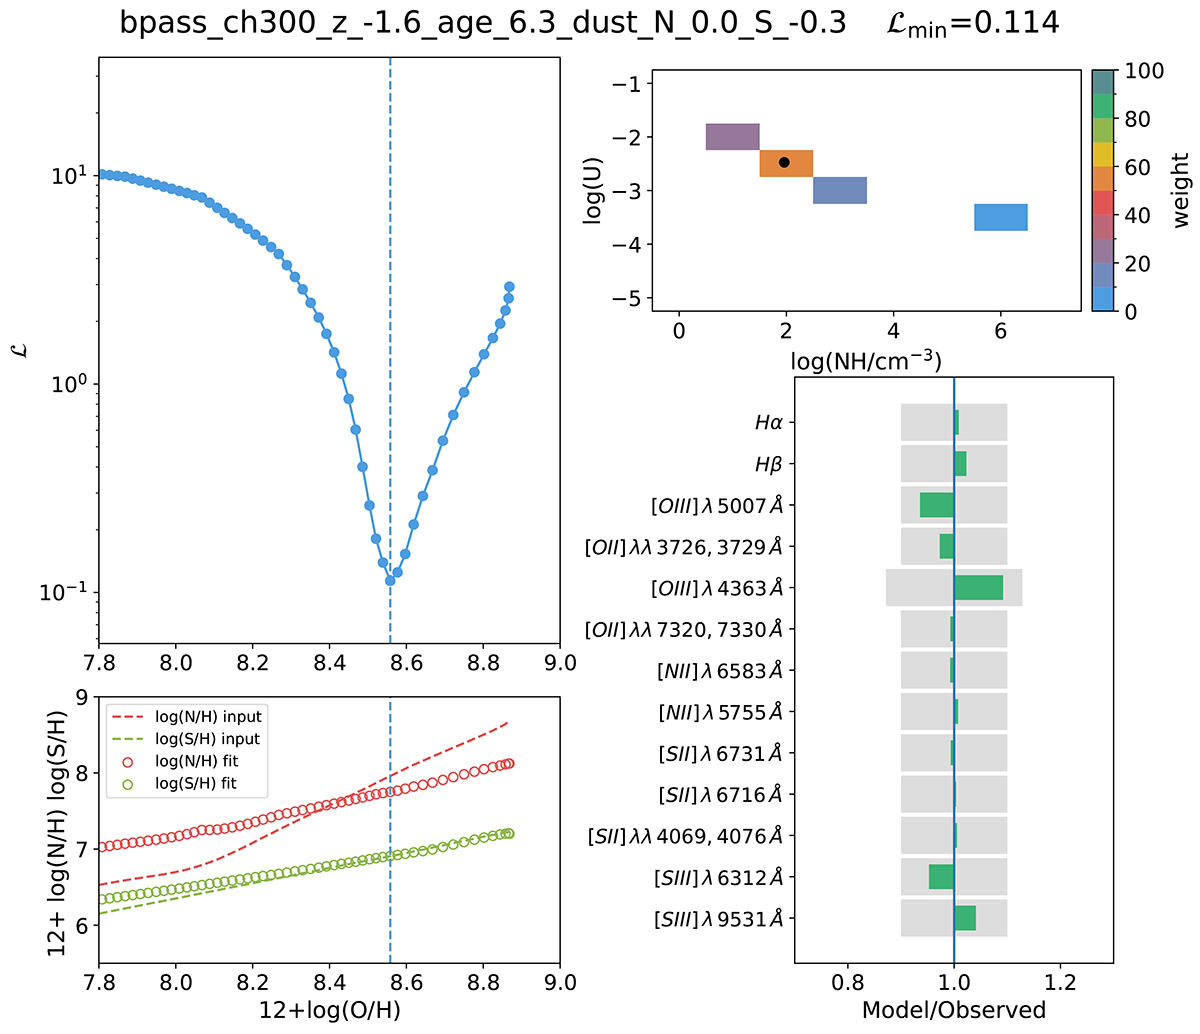
Download original image
Example of model fit to the emission line spectrum of an H II region. Top-left panel: variation of the loss function ℒ as a function of the oxygen abundance, 12 + log(O/H), for the emission line spectrum of the test HII region. In this scale, the solar metallicity is 8.69. The blue vertical dashed line represents the metallicity of the model with the minimum value of ℒ. Bottom-left panel: variation of the N and S abundances as a function of the oxygen one. The dashed lines represent the values adopted for the computation of the photoionization models, while the filled circles correspond to the abundances rescaled as described in the text. Top-right panel: grid of single-cloud models in log(U) and log(NH). The colors represent the weights of each single-cloud model, as indicated by the color bar, when ℒ reaches the minimum value. In this case only four out of 72 models of the grid have non-zero weights. The black dot represents the weighted density and ionization parameter of the single-cloud models. Bottom-right panel: ratio between the model and observed line luminosities. The gray areas represent the acceptable discrepancy of ±10% or, when larger, the relative error on the observed value.
Current usage metrics show cumulative count of Article Views (full-text article views including HTML views, PDF and ePub downloads, according to the available data) and Abstracts Views on Vision4Press platform.
Data correspond to usage on the plateform after 2015. The current usage metrics is available 48-96 hours after online publication and is updated daily on week days.
Initial download of the metrics may take a while.