Fig. 10.
Download original image
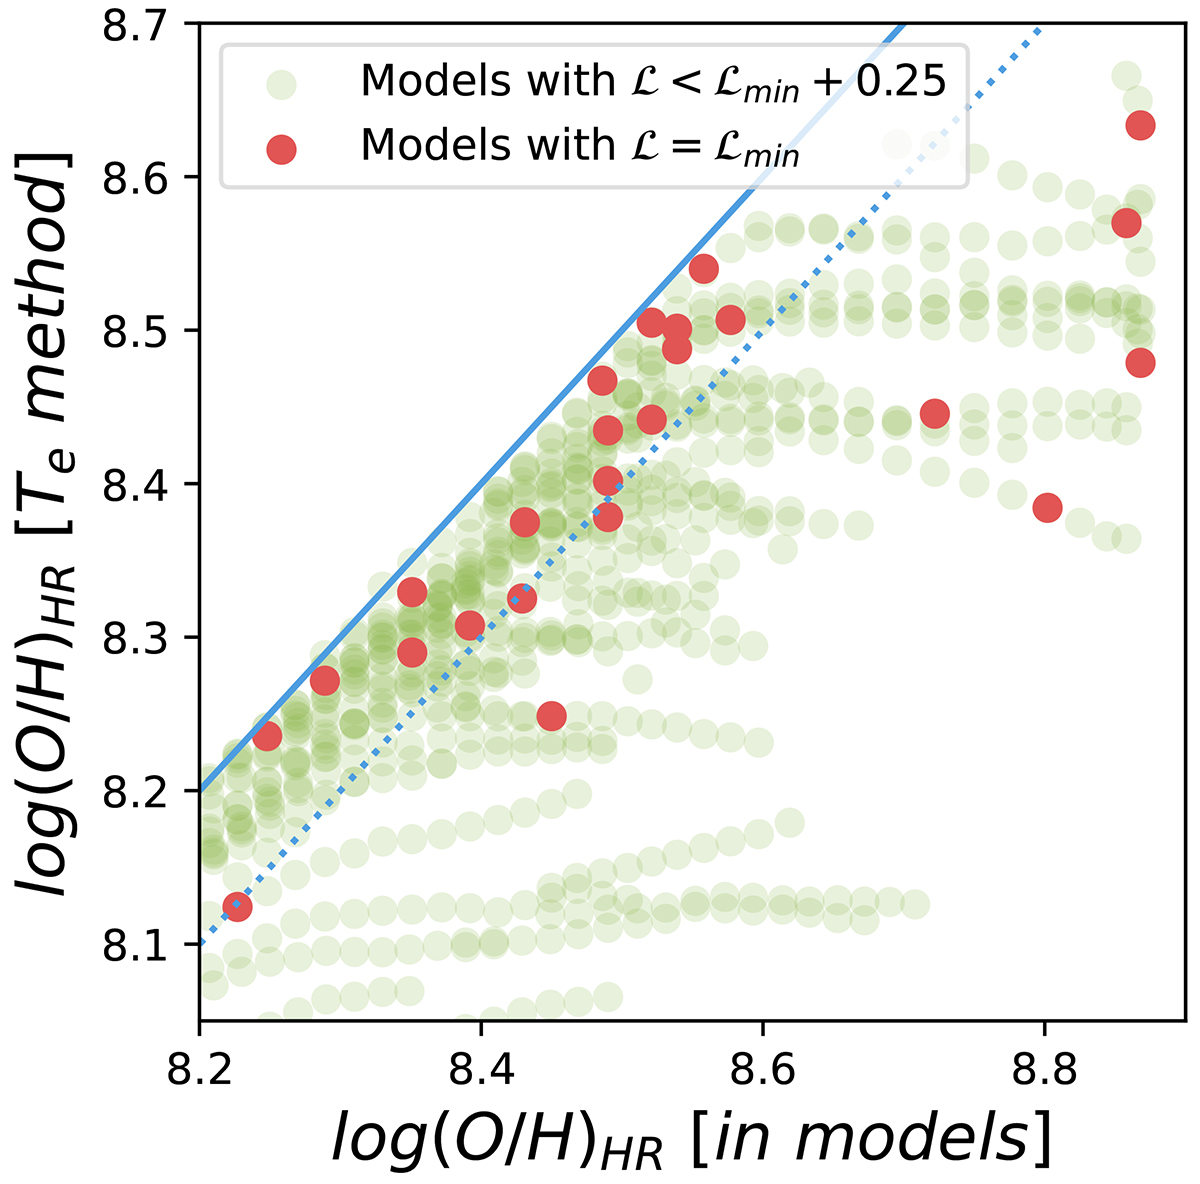
Comparison between the model metallicities inferred from the multi-cloud modeling of the CHAOS sample (x axis) and the Te metallicities derived from the line fluxes predicted by the same models (y models). The red dots represent the best models for each HII region of the sample, while the green dots represent all “acceptable” models, that is those with ℒ < ℒmin + 0.25. The solid blue line represents the 1:1 relation, while the dotted blue line represents the case where Te metallicities are 0.1 dex lower than model metallicities.
Current usage metrics show cumulative count of Article Views (full-text article views including HTML views, PDF and ePub downloads, according to the available data) and Abstracts Views on Vision4Press platform.
Data correspond to usage on the plateform after 2015. The current usage metrics is available 48-96 hours after online publication and is updated daily on week days.
Initial download of the metrics may take a while.