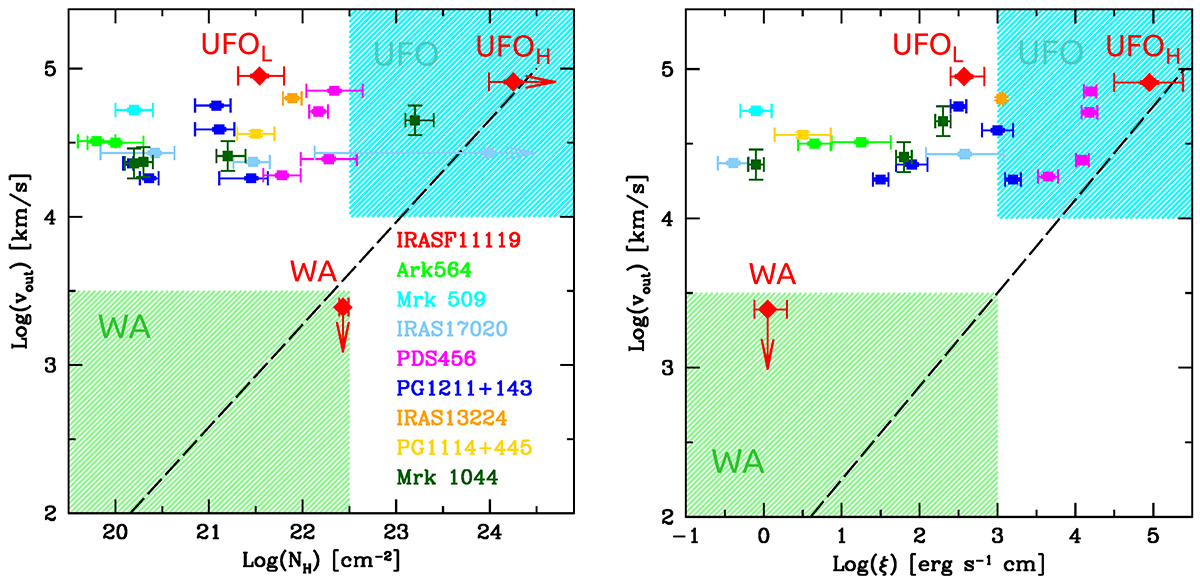
Fig. 6.
Download original image
log(NH) vs. vout (left) and log(ξ) vs. vout (right) for the WA, UFOL, and UFOH components of IRASF11119 (red diamonds). The known soft-band detected fast winds from the literature are shown with colored points: light green (Gupta et al. 2013b); cyan (Gupta et al. 2015); sky blue (Longinotti et al. 2015); magenta (Reeves et al. 2016); blue (Pounds et al. 2016); orange (Jiang et al. 2018); yellow (Serafinelli et al. 2019); dark green (Krongold et al. 2021). The low-velocity WAs region (green), UFOs region (cyan), and the correlation fits linking low-velocity WAs and UFOs (dashed black lines) are derived from Tombesi et al. (2013).
Current usage metrics show cumulative count of Article Views (full-text article views including HTML views, PDF and ePub downloads, according to the available data) and Abstracts Views on Vision4Press platform.
Data correspond to usage on the plateform after 2015. The current usage metrics is available 48-96 hours after online publication and is updated daily on week days.
Initial download of the metrics may take a while.