Fig. 5.
Download original image
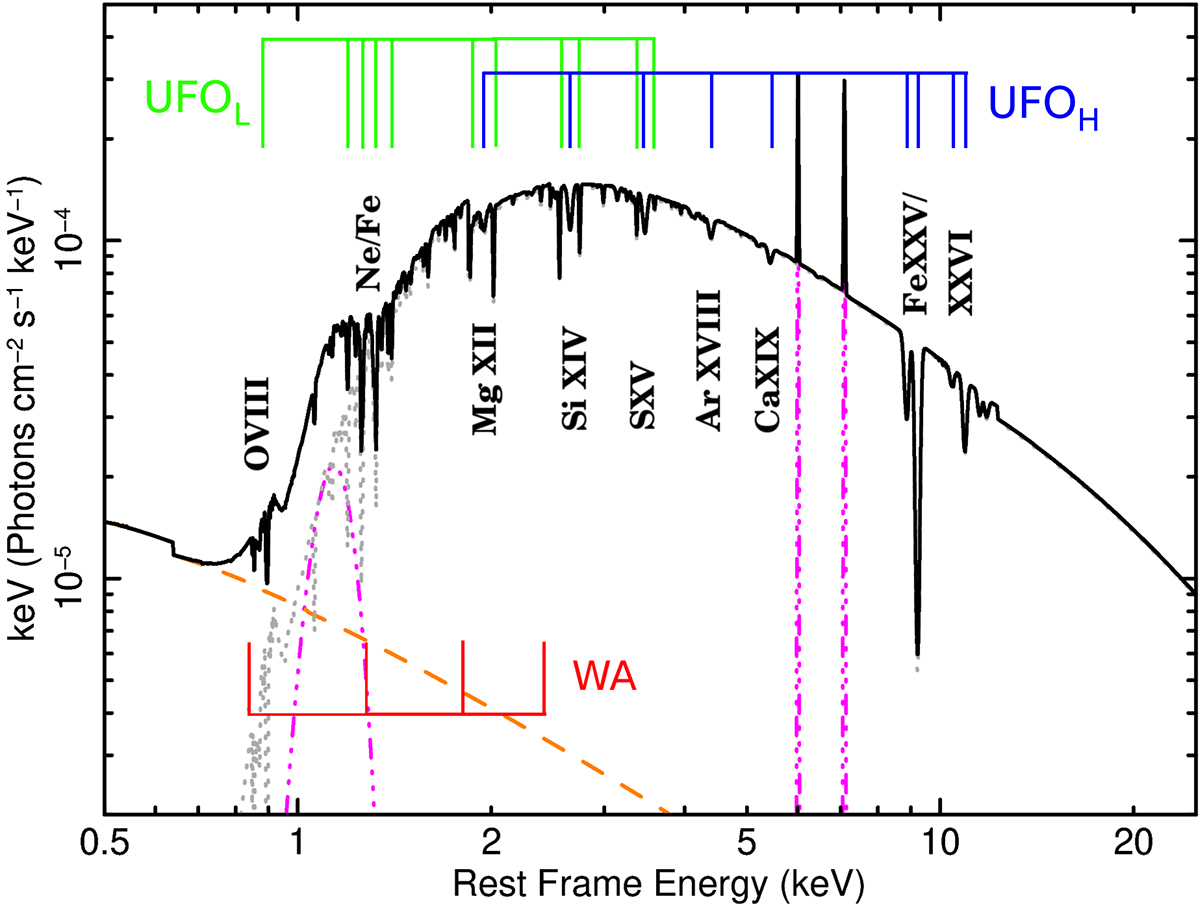
Unfolded best-fit model (black) in νF(ν) including three XSTAR absorption tables. The emission lines are shown in magenta, and the scattered emission is in orange. The main absorption features due to the WA, UFOL, and UFOH are labeled in red, green, and blue, respectively. The ions producing the most prominent features are labeled in black.
Current usage metrics show cumulative count of Article Views (full-text article views including HTML views, PDF and ePub downloads, according to the available data) and Abstracts Views on Vision4Press platform.
Data correspond to usage on the plateform after 2015. The current usage metrics is available 48-96 hours after online publication and is updated daily on week days.
Initial download of the metrics may take a while.