Fig. 4.
Download original image
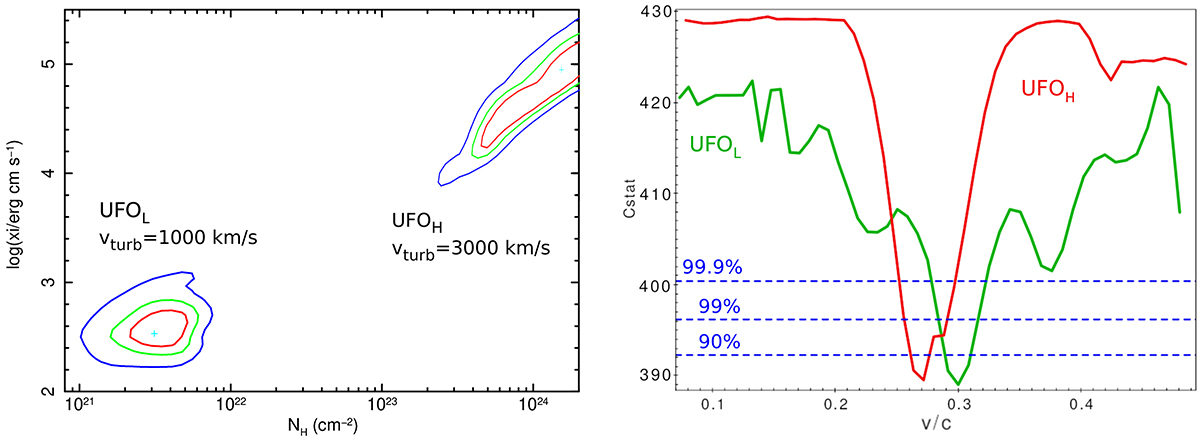
Left: confidence contour levels of the column density NH and the ionization parameter log(ξ/erg cm s−1), for the best-fit model with two XSTAR tables, one with vturb = 1000 km s−1 for the low-ionization table UFOL and one with vturb = 3000 km s−1 for the high-ionization UFOH one. Right: contour plot of the outflow velocity for the UFOH in red and for UFOL in green. The blue lines mark one parameter’s 90, 99, and 99.9% confidence levels.
Current usage metrics show cumulative count of Article Views (full-text article views including HTML views, PDF and ePub downloads, according to the available data) and Abstracts Views on Vision4Press platform.
Data correspond to usage on the plateform after 2015. The current usage metrics is available 48-96 hours after online publication and is updated daily on week days.
Initial download of the metrics may take a while.