Fig. 13.
Download original image
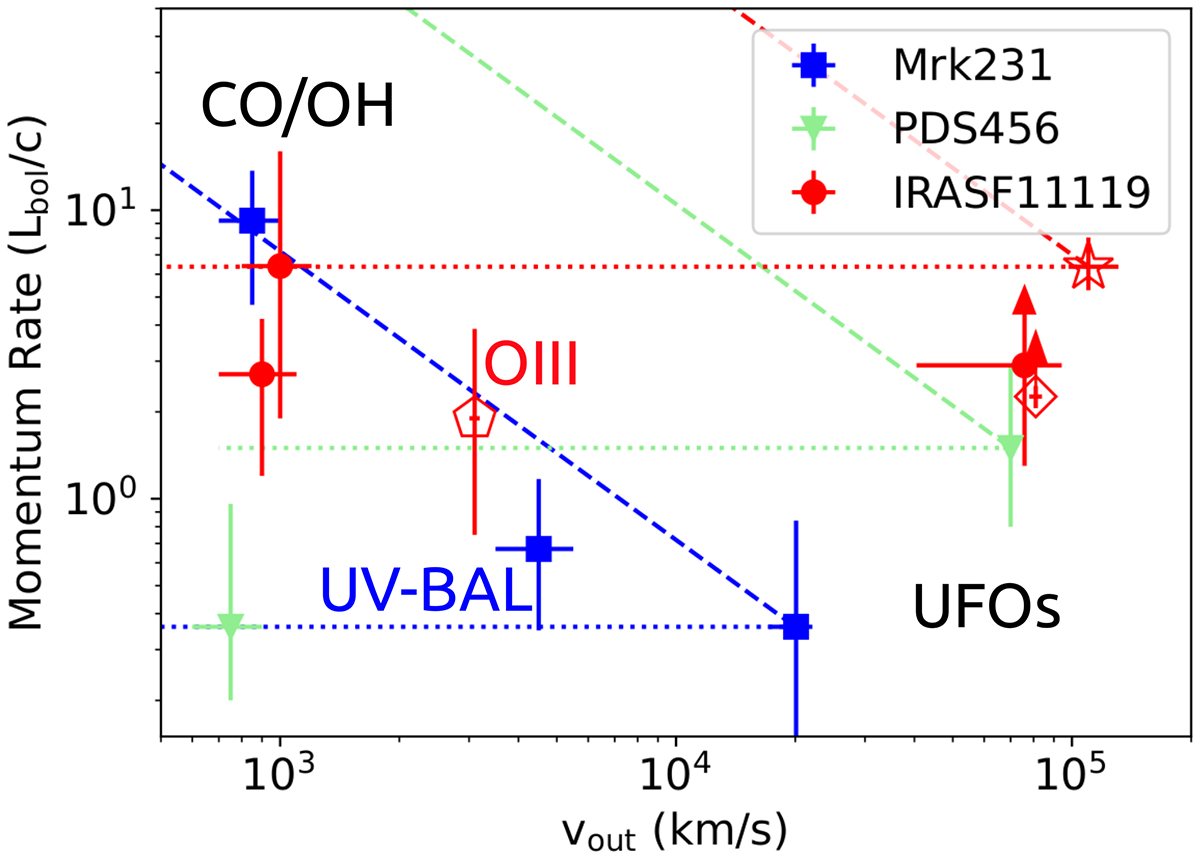
Momentum rate vs. outflow velocity of different outflow phases for three well-known targets. Red symbols refer to IRASF11119: filled circles are taken from Nardini & Zubovas (2018). The empty diamond shows the UFOH momentum rate derived from the XSTAR fit, while the empty star shows the results from the DISK-WIND fit. The empty pentagon shows the momentum rate of the large-scale ionized outflow observed in [OIII]. Blue squares refer to Mrk231 (Feruglio et al. 2015) and green triangles to PDS456 (Bischetti et al. 2019). Data points at vout ∼ 103 km s−1 refer to molecular outflows detected in CO or OH. Data points at intermediate velocities (3 − 5000 km s−1) refer to OIII and UV winds, while at vout > 104 km s−1 refer to UFOs. Dotted horizontal lines show the expected evolution of a momentum-driven outflow, while dashed lines show the momentum boost expected for an energy-driven outflow.
Current usage metrics show cumulative count of Article Views (full-text article views including HTML views, PDF and ePub downloads, according to the available data) and Abstracts Views on Vision4Press platform.
Data correspond to usage on the plateform after 2015. The current usage metrics is available 48-96 hours after online publication and is updated daily on week days.
Initial download of the metrics may take a while.