Fig. 12.
Download original image
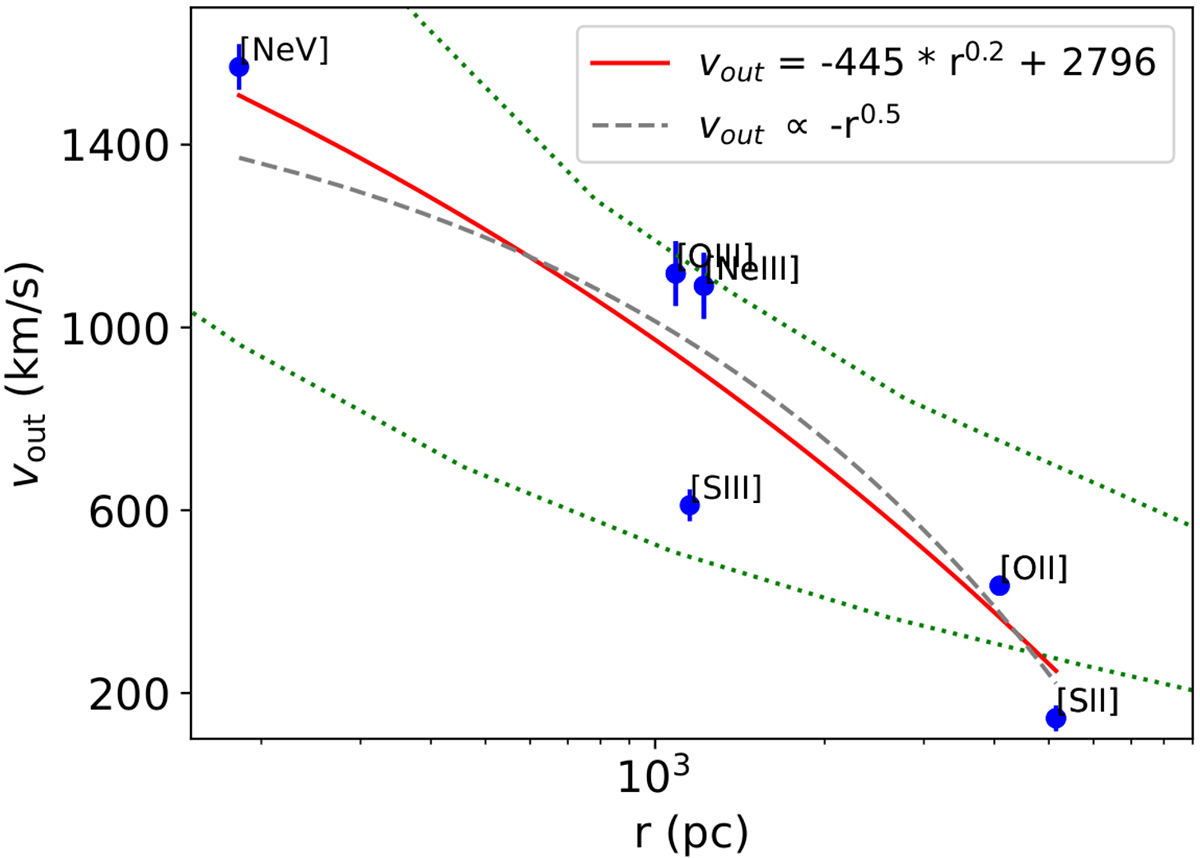
Distance from the ionizing source vs. velocity offset for different emission lines (labeled) modeled in the SDSS spectrum. The distance is derived from the ionization level at which each ion has the peak of relative abundance. The red curve is a power-law fit of the form vout = a × rb + c with the best-fit slope b = 0.20 ± 0.07. The gray dashed line shows a curve with a slope fixed to b = 0.5, the value for a simple ballistic trajectory. The dotted green curves are taken from the analytic treatment of an expanding AGN-driven wind presented in Faucher-Giguère & Quataert (2012), for vin = 0.1c, and central density n0 = 10 (top) and n0 = 100 (bottom) cm−3.
Current usage metrics show cumulative count of Article Views (full-text article views including HTML views, PDF and ePub downloads, according to the available data) and Abstracts Views on Vision4Press platform.
Data correspond to usage on the plateform after 2015. The current usage metrics is available 48-96 hours after online publication and is updated daily on week days.
Initial download of the metrics may take a while.