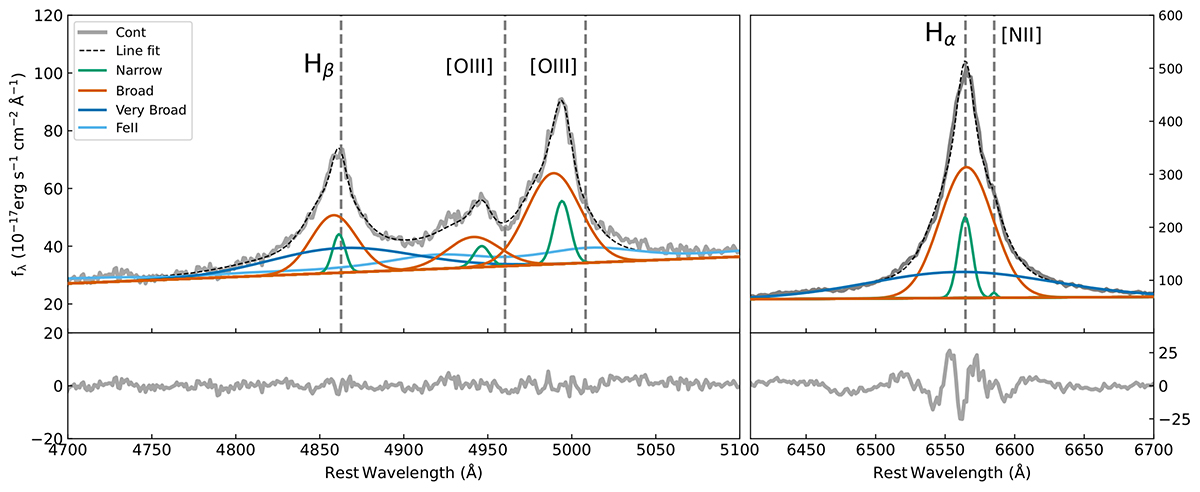
Fig. 11.
Download original image
Hβ, [OIII], and Hα regions of the optical spectrum of IRASF11119. The observed spectrum is plotted in gray, while the best fit is shown as the black dashed line. Different model components are traced by lines of different colors, as indicated by the label. The vertical dashed lines indicate the rest-frame wavelength for each labeled emission line, for z = 0.187. In the bottom panels, residuals are plotted. Note that the Hα shows significant residuals, possibly due to the blending with the [NII] doublet, but this effect is negligible for our goals.
Current usage metrics show cumulative count of Article Views (full-text article views including HTML views, PDF and ePub downloads, according to the available data) and Abstracts Views on Vision4Press platform.
Data correspond to usage on the plateform after 2015. The current usage metrics is available 48-96 hours after online publication and is updated daily on week days.
Initial download of the metrics may take a while.