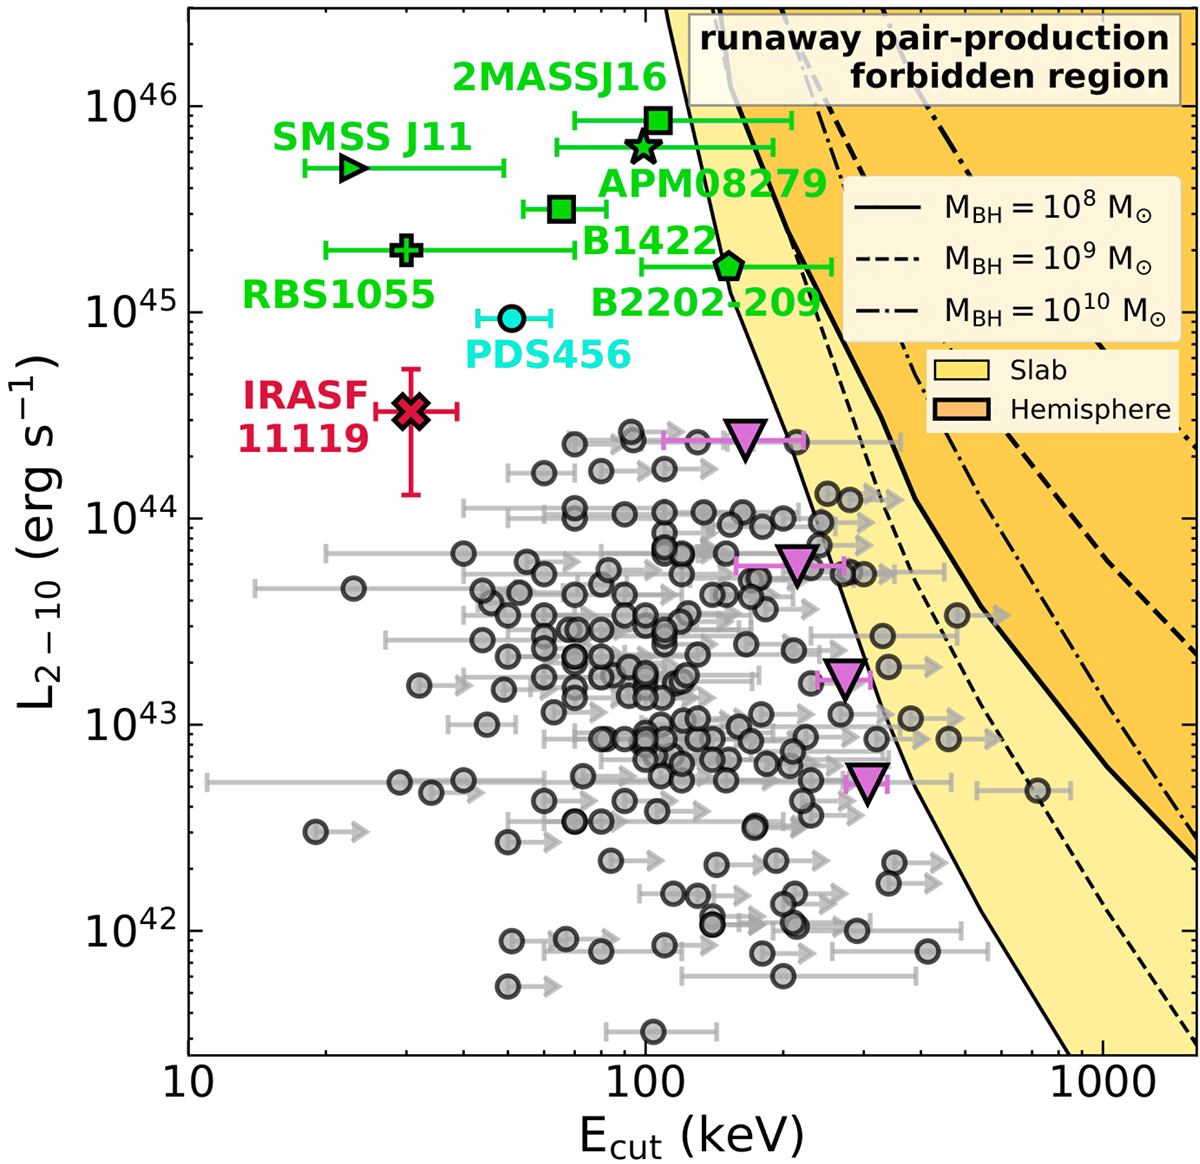
Fig. 10.
Download original image
High-energy cutoff vs. intrinsic luminosity for local Seyferts measured with NuSTAR (gray dots, from the updated sample of Bertola et al. 2022), and the binned results from the BAT-selected sample (magenta downward pointing triangles, Ricci et al. 2018). Green data points show results for luminous quasars at z ≳ 0.5: pentagon from Kammoun et al. (2017); squares Lanzuisi et al. (2019); star Bertola et al. (2022); plus Marinucci et al. (2022); right-ward triangle Kammoun et al. (2023). PDS456 (Reeves et al. 2021) is shown in cyan and IRASF11119 in red. The different intrinsic luminosities obtained from the XSTAR and DISK-WIND fits are shown by the vertical error bar. The yellow/orange areas show the runaway pair-production forbidden region (Fabian et al. 2015; Lanzuisi et al. 2019) for different geometries and BH masses.
Current usage metrics show cumulative count of Article Views (full-text article views including HTML views, PDF and ePub downloads, according to the available data) and Abstracts Views on Vision4Press platform.
Data correspond to usage on the plateform after 2015. The current usage metrics is available 48-96 hours after online publication and is updated daily on week days.
Initial download of the metrics may take a while.