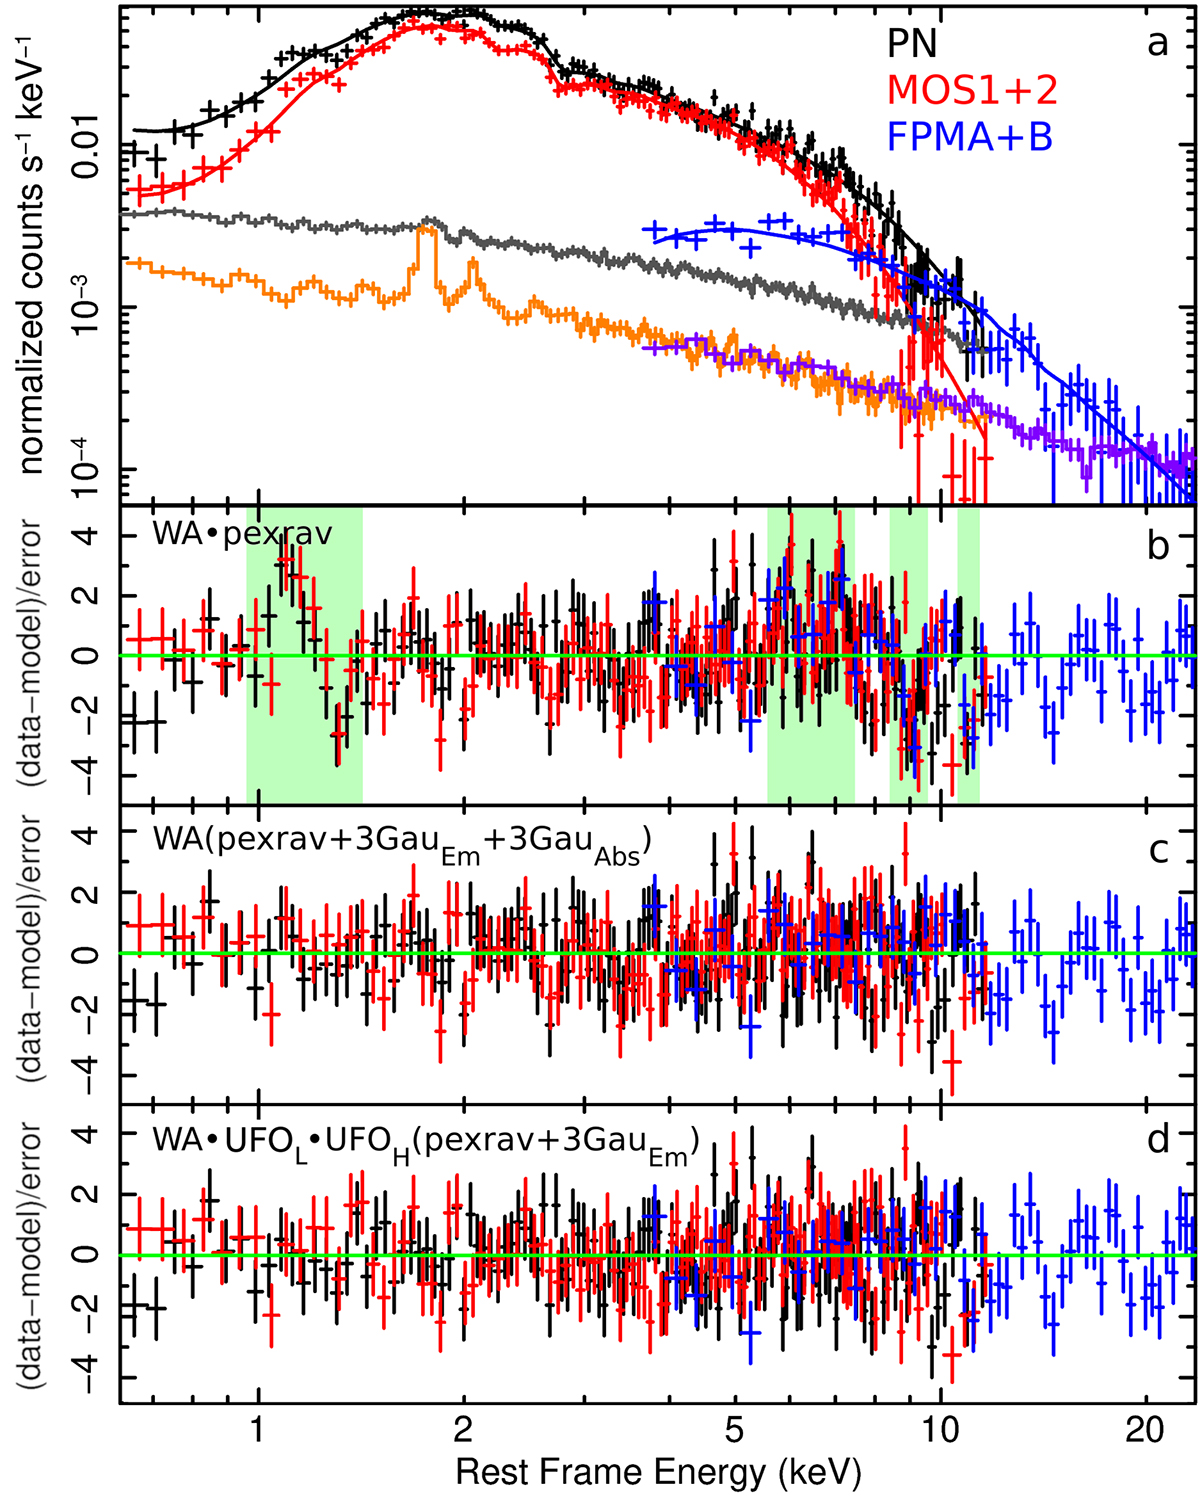
Fig. 1.
Download original image
XMM-Newton and NuSTAR spectra and continuum models and their residuals. a: background subtracted XMM-Newton (pn in black, MOS1+2 in red) and NuSTAR (FPMA+B in blue) spectra, and their corresponding background levels (gray, orange, and violet, respectively) are shown with the baseline continuum model (see Sect. 4.1). The MOS1 and 2 and FPM-A and -B spectra have been merged for plotting purposes. b: residuals (data-model/error), with respect to the baseline continuum model. In green, we highlight the energy ranges where the most prominent positive and negative residuals are found (see Sect. 4.2). c: residuals after including three emissions and three absorption Gaussian features (see Sect. 5). d: residuals after including two XSTAR tables to model the soft and hard band absorption features (see Sect. 6.1).
Current usage metrics show cumulative count of Article Views (full-text article views including HTML views, PDF and ePub downloads, according to the available data) and Abstracts Views on Vision4Press platform.
Data correspond to usage on the plateform after 2015. The current usage metrics is available 48-96 hours after online publication and is updated daily on week days.
Initial download of the metrics may take a while.