Open Access
Fig. B.1.
Download original image
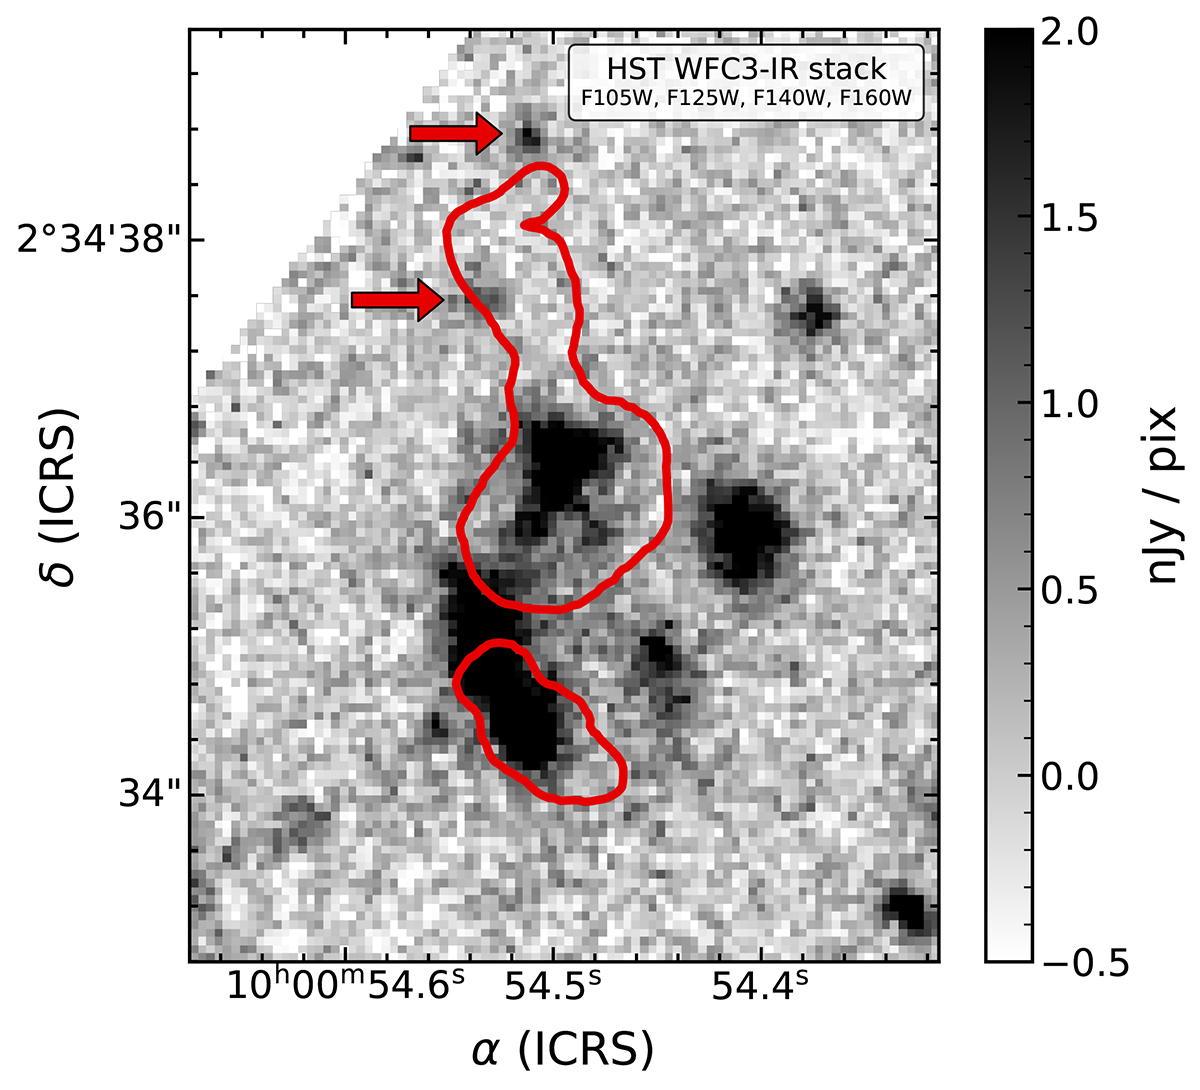
Stack of HST/WFC3-IR imaging of J1000+0234 with the outline of the [C II] emission in red. Arrows indicate the positions of the two sources potentially associated with the plume.
Current usage metrics show cumulative count of Article Views (full-text article views including HTML views, PDF and ePub downloads, according to the available data) and Abstracts Views on Vision4Press platform.
Data correspond to usage on the plateform after 2015. The current usage metrics is available 48-96 hours after online publication and is updated daily on week days.
Initial download of the metrics may take a while.