Fig. 4.
Download original image
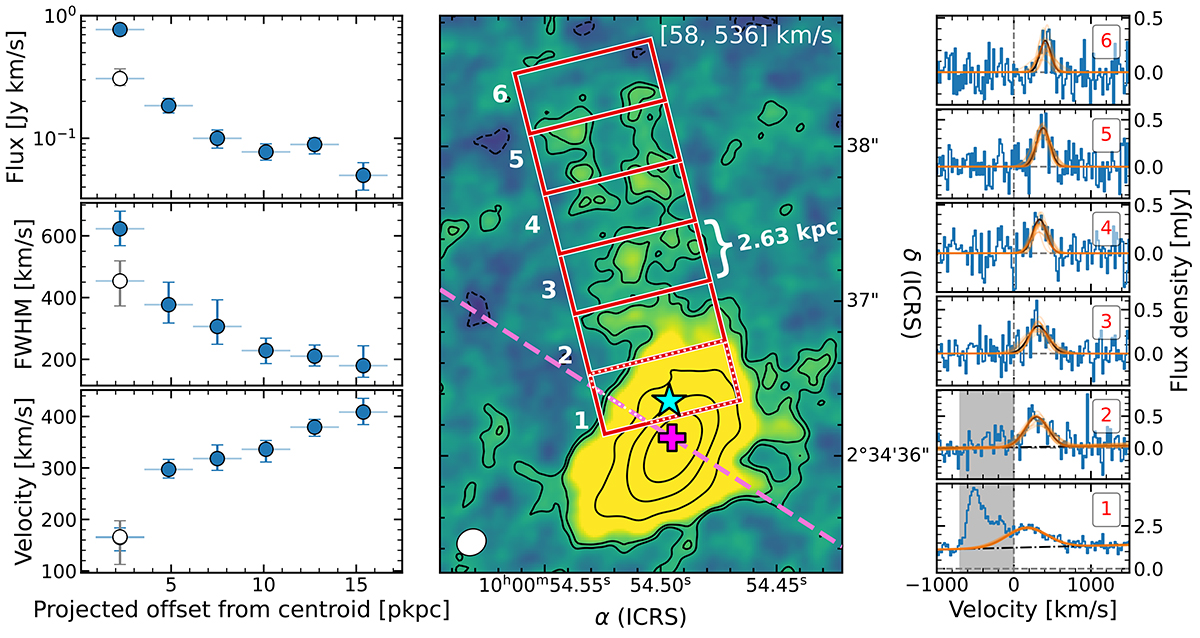
Spatial variation of spectral properties of the [C II] plume. Left: radial profiles of fitted 1D Gaussian parameters in six apertures along the plume, as a function of projected distance from the kinematic center of the DSFG. The parameters shown are the integrated flux (top), the line FWHM (middle) and velocity centroid (bottom). White-filled markers in the first bin indicate best-fit values for the innermost spectrum after reducing contamination with our symmetric difference method. Center: [C II] intensity map integrated from 58 km s−1 to 536 km s−1, with black contours at the {±2,3,15,50,150} × σ SB level. Red rectangles numbered from 1 to 6 delineate the extraction apertures along the plume. The cyan star and pink cross mark the position of the rest-UV and the [C II] kinematic centroids, respectively. The dashed line extrapolates the minor axis of the DSFG’s [C II] integrated emission at a PA = ![]() (see Sect. 4.2). The line intersects the first rectangular aperture, defining a polygonal subregion where we extract the spectrum for symmetric difference analysis (see Appendix A). Right: extracted spectra from the six rectangular apertures, with their number labeled in red. The black solid line in each panel shows the maximum likelihood fit, while the orange lines are random samples from the posterior probability distribution. In panels 1 and 2 the shaded area indicates the velocity range excluded from the fit. The dash-dotted line shows the best-fit continuum component.
(see Sect. 4.2). The line intersects the first rectangular aperture, defining a polygonal subregion where we extract the spectrum for symmetric difference analysis (see Appendix A). Right: extracted spectra from the six rectangular apertures, with their number labeled in red. The black solid line in each panel shows the maximum likelihood fit, while the orange lines are random samples from the posterior probability distribution. In panels 1 and 2 the shaded area indicates the velocity range excluded from the fit. The dash-dotted line shows the best-fit continuum component.
Current usage metrics show cumulative count of Article Views (full-text article views including HTML views, PDF and ePub downloads, according to the available data) and Abstracts Views on Vision4Press platform.
Data correspond to usage on the plateform after 2015. The current usage metrics is available 48-96 hours after online publication and is updated daily on week days.
Initial download of the metrics may take a while.