Open Access
Fig. 3.
Download original image
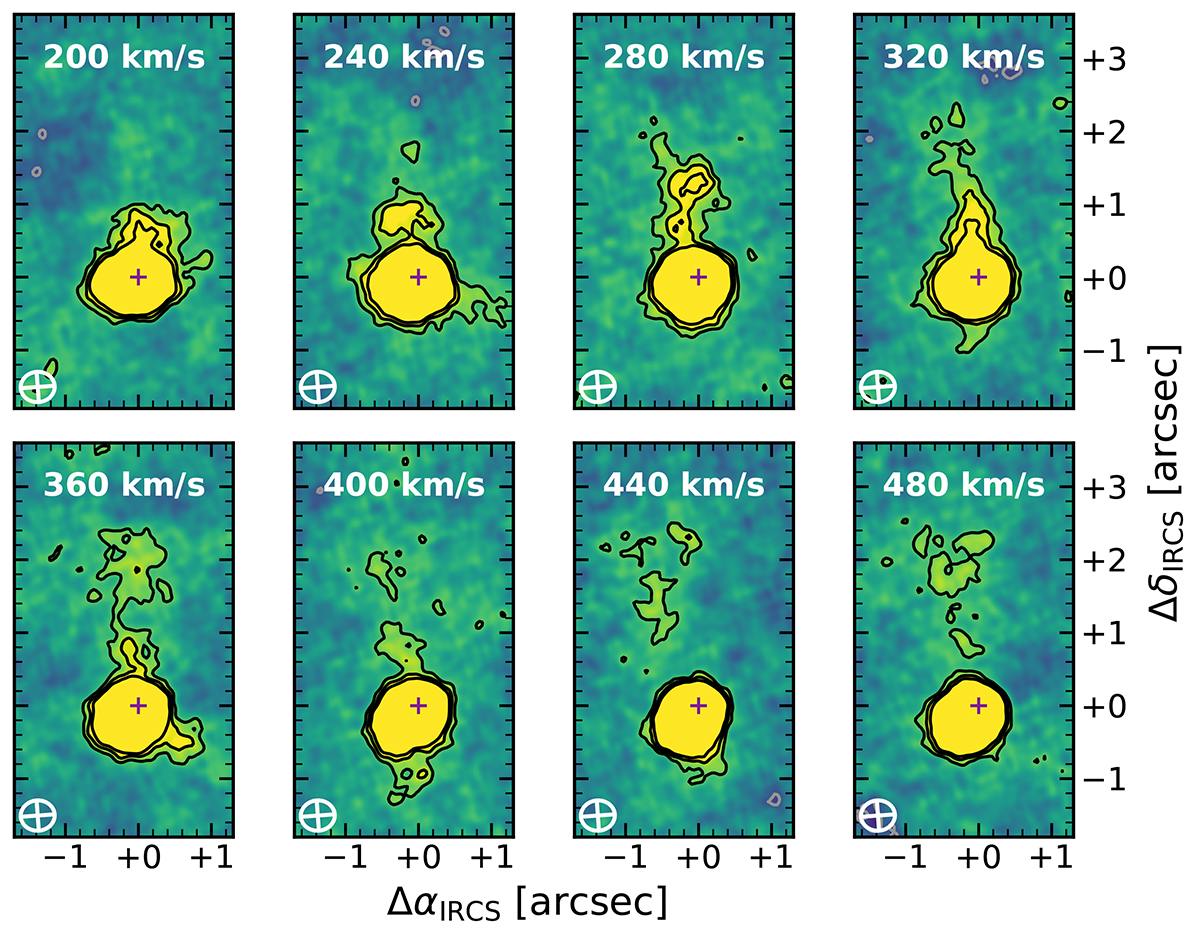
Selected channel maps from the low-resolution [C II] datacube binned to 40 km s−1. Black contours represent 3, 5 and 7 times the JvM-corrected noise rms level, while the gray contours show the negative 3 × rms level. The purple cross in each channel indicates the origin of the coordinates, at ![]() ,
, ![]() .
.
Current usage metrics show cumulative count of Article Views (full-text article views including HTML views, PDF and ePub downloads, according to the available data) and Abstracts Views on Vision4Press platform.
Data correspond to usage on the plateform after 2015. The current usage metrics is available 48-96 hours after online publication and is updated daily on week days.
Initial download of the metrics may take a while.