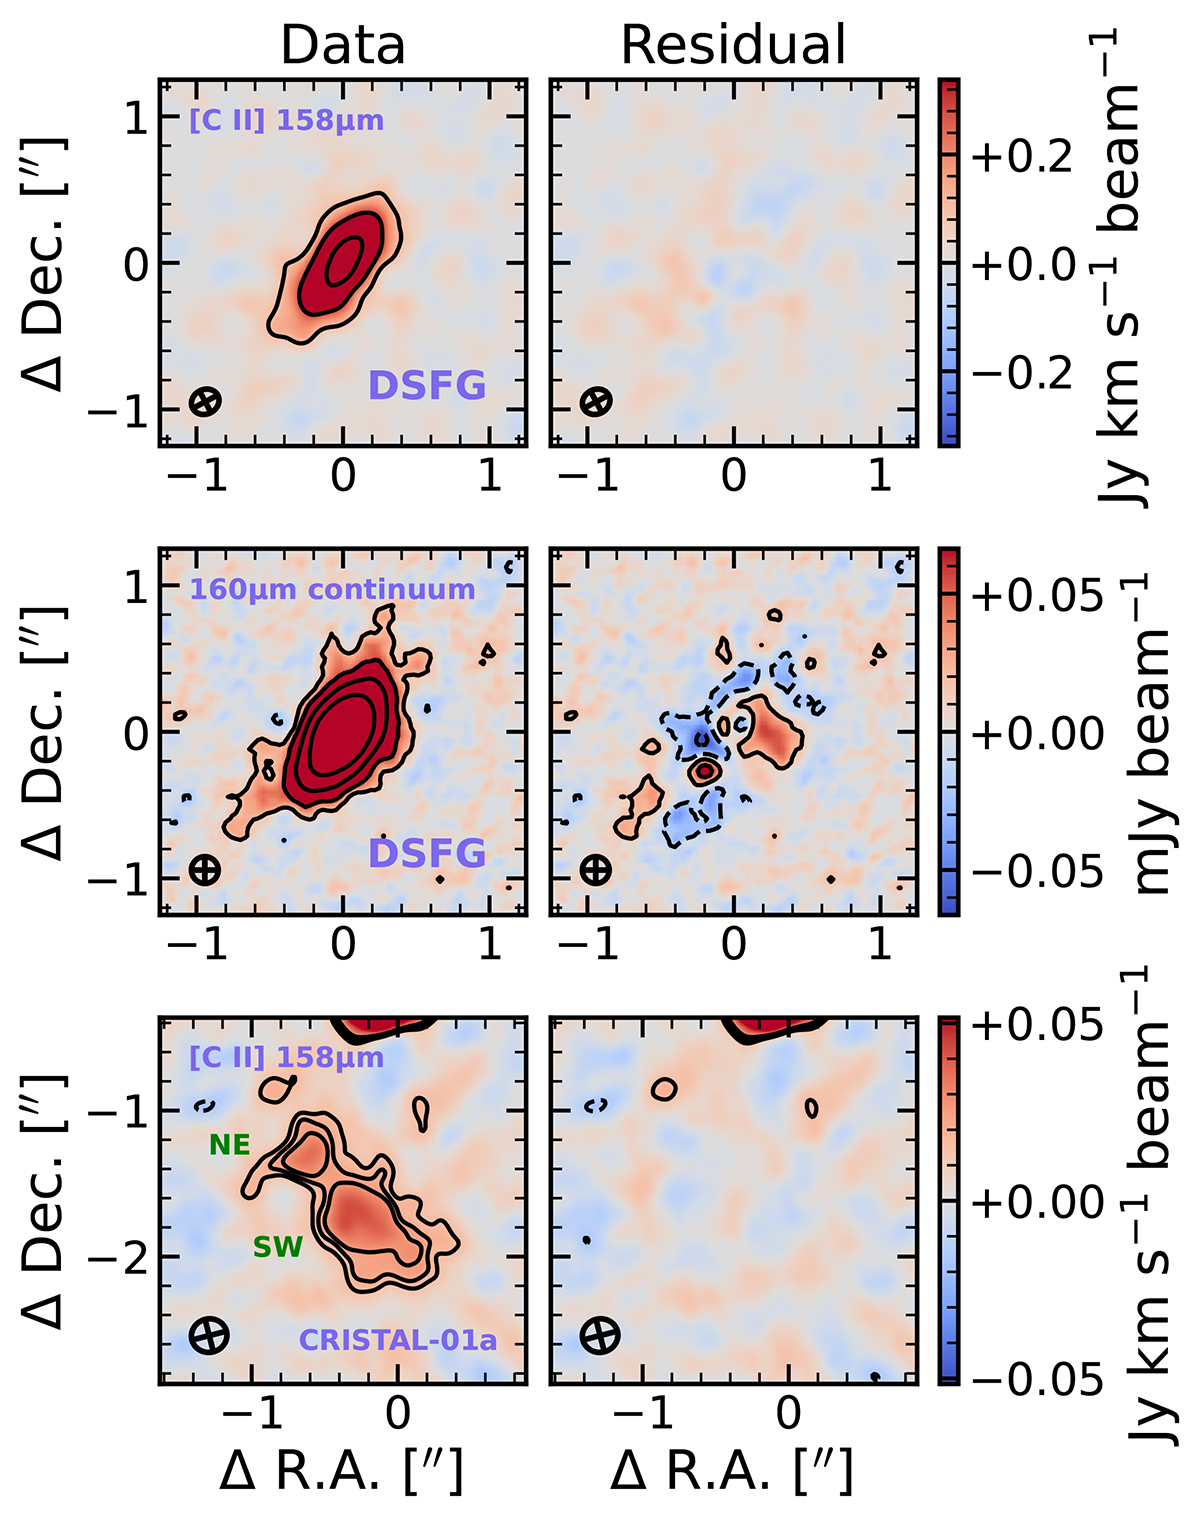
Fig. 2.
Download original image
Results from parametric 2D modeling with PYAUTOGALAXY. Each row shows a different source and/or image. Left column displays the observed emission, while the right column shows the residuals after subtracting the maximum likelihood model. The first and second rows show the modeling of the DSFG’s [C II] emission and 160 μm dust continuum, respectively. Black contours represent the ±3, 9, 27 and 81σ levels. Results for the [C II] emission of CRISTAL-01a (CRISTAL-1) are shown in the third row. Here, the contours only trace ±3, 4 and 5σ levels.
Current usage metrics show cumulative count of Article Views (full-text article views including HTML views, PDF and ePub downloads, according to the available data) and Abstracts Views on Vision4Press platform.
Data correspond to usage on the plateform after 2015. The current usage metrics is available 48-96 hours after online publication and is updated daily on week days.
Initial download of the metrics may take a while.