Fig. 1.
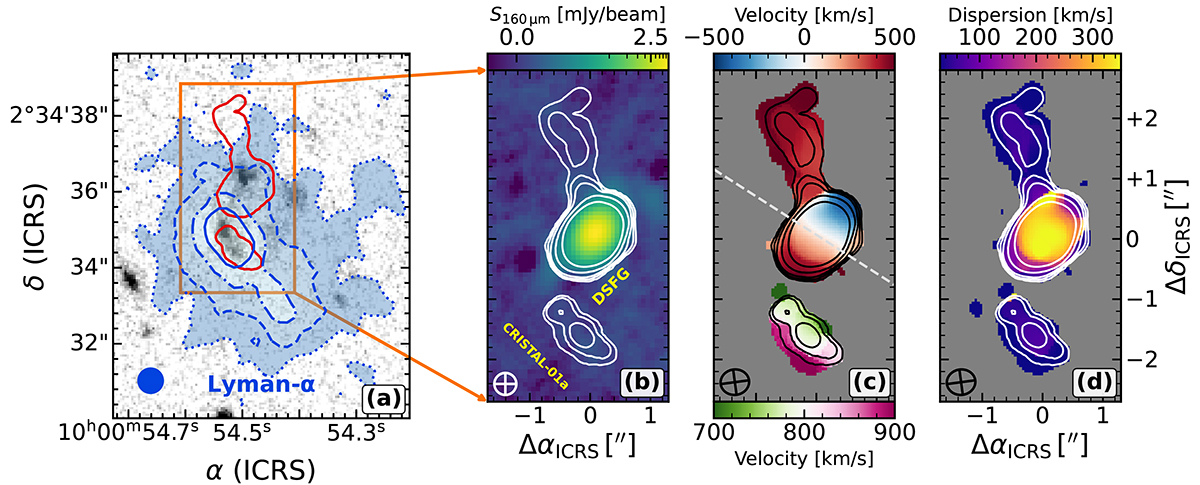
Download original image
HST, Lyα, and [C II] morphologies. (a). 10″ × 6″ cutout of the WFC3/F160W image in grayscale. The blue-filled contours represent {1,5,16,30} × 10−18 erg s−1 cm−2 arcsec−2 levels of Lyα surface brightness based on the adaptive narrowband image described in the main text. The diameter of the blue circle represents the FWHM = ![]() of the PSF of the VLT/MUSE observations. The orange box outlines the
of the PSF of the VLT/MUSE observations. The orange box outlines the ![]() zoom-in region displayed in the next panels. (b). ALMA Band 7 continuum image in logarithmic stretch. The white contours follow [C II] emission at {0.01,0.03,0.07,0.2,0.5} × Jy km s−1, and highlight the non-detection of dust continuum in either CRISTAL-01a or the plume. (c). Adaptively masked [C II] velocity field (moment-1). A single colormap is assigned separately to the DSFG and CRISTAL-01a. The midpoint of the colormaps matches their corresponding systemic velocity, with the zero set at the redshift of the DSFG, z[CII] = 4.5391. Again, overlaid contours show increasing levels of [C II] SB. The dashed line indicates the projected rotation axis at a
zoom-in region displayed in the next panels. (b). ALMA Band 7 continuum image in logarithmic stretch. The white contours follow [C II] emission at {0.01,0.03,0.07,0.2,0.5} × Jy km s−1, and highlight the non-detection of dust continuum in either CRISTAL-01a or the plume. (c). Adaptively masked [C II] velocity field (moment-1). A single colormap is assigned separately to the DSFG and CRISTAL-01a. The midpoint of the colormaps matches their corresponding systemic velocity, with the zero set at the redshift of the DSFG, z[CII] = 4.5391. Again, overlaid contours show increasing levels of [C II] SB. The dashed line indicates the projected rotation axis at a ![]() through the [C II] kinematic center of the DSFG (see Appendix A). (d). Adaptively masked [C II] velocity dispersion map (moment-2), with [C II] SB contours.
through the [C II] kinematic center of the DSFG (see Appendix A). (d). Adaptively masked [C II] velocity dispersion map (moment-2), with [C II] SB contours.
Current usage metrics show cumulative count of Article Views (full-text article views including HTML views, PDF and ePub downloads, according to the available data) and Abstracts Views on Vision4Press platform.
Data correspond to usage on the plateform after 2015. The current usage metrics is available 48-96 hours after online publication and is updated daily on week days.
Initial download of the metrics may take a while.