Fig. 9.
Download original image
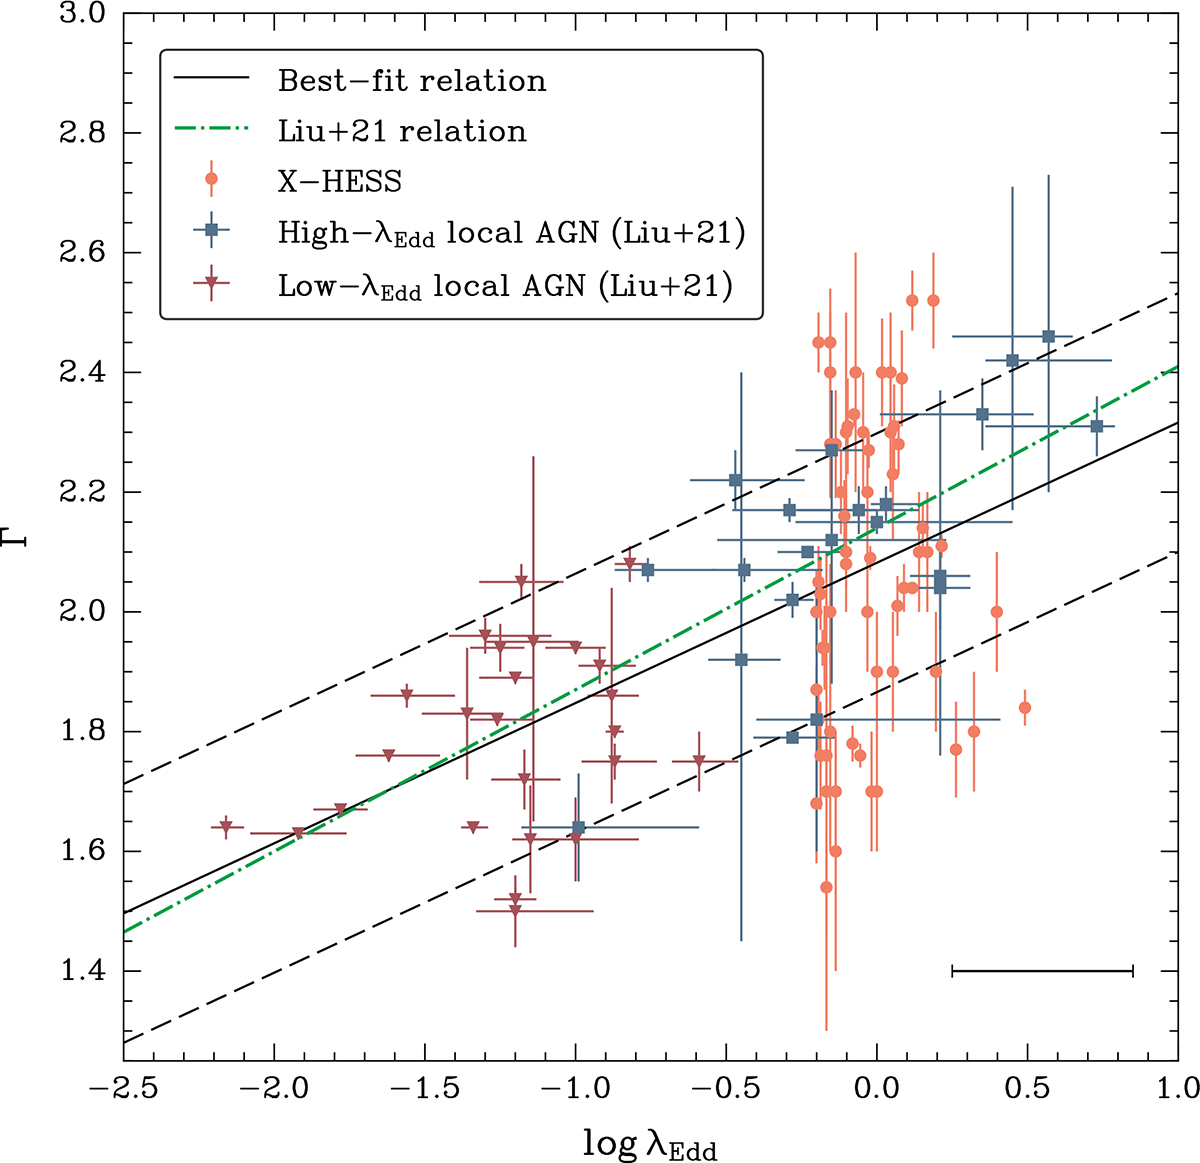
Distribution of the X-HESS AGNs (orange circles) and the high-λEdd (blue squares) and low-λEdd local AGNs (red triangles) from Liu et al. (2021) in the Γ − log λEdd plane. For the multi-epoch X-HESS AGNs, we considered the Γ associated with their high-flux state. The black error bar in the lower right corner represents the average uncertainty on the X-HESS sources. Solid and dashed black lines describe the best-fit relation and its 1σ spread, respectively. The dash-dotted green line represents the Liu et al. (2021) best-fit relation, for comparison.
Current usage metrics show cumulative count of Article Views (full-text article views including HTML views, PDF and ePub downloads, according to the available data) and Abstracts Views on Vision4Press platform.
Data correspond to usage on the plateform after 2015. The current usage metrics is available 48-96 hours after online publication and is updated daily on week days.
Initial download of the metrics may take a while.