Fig. 6.
Download original image
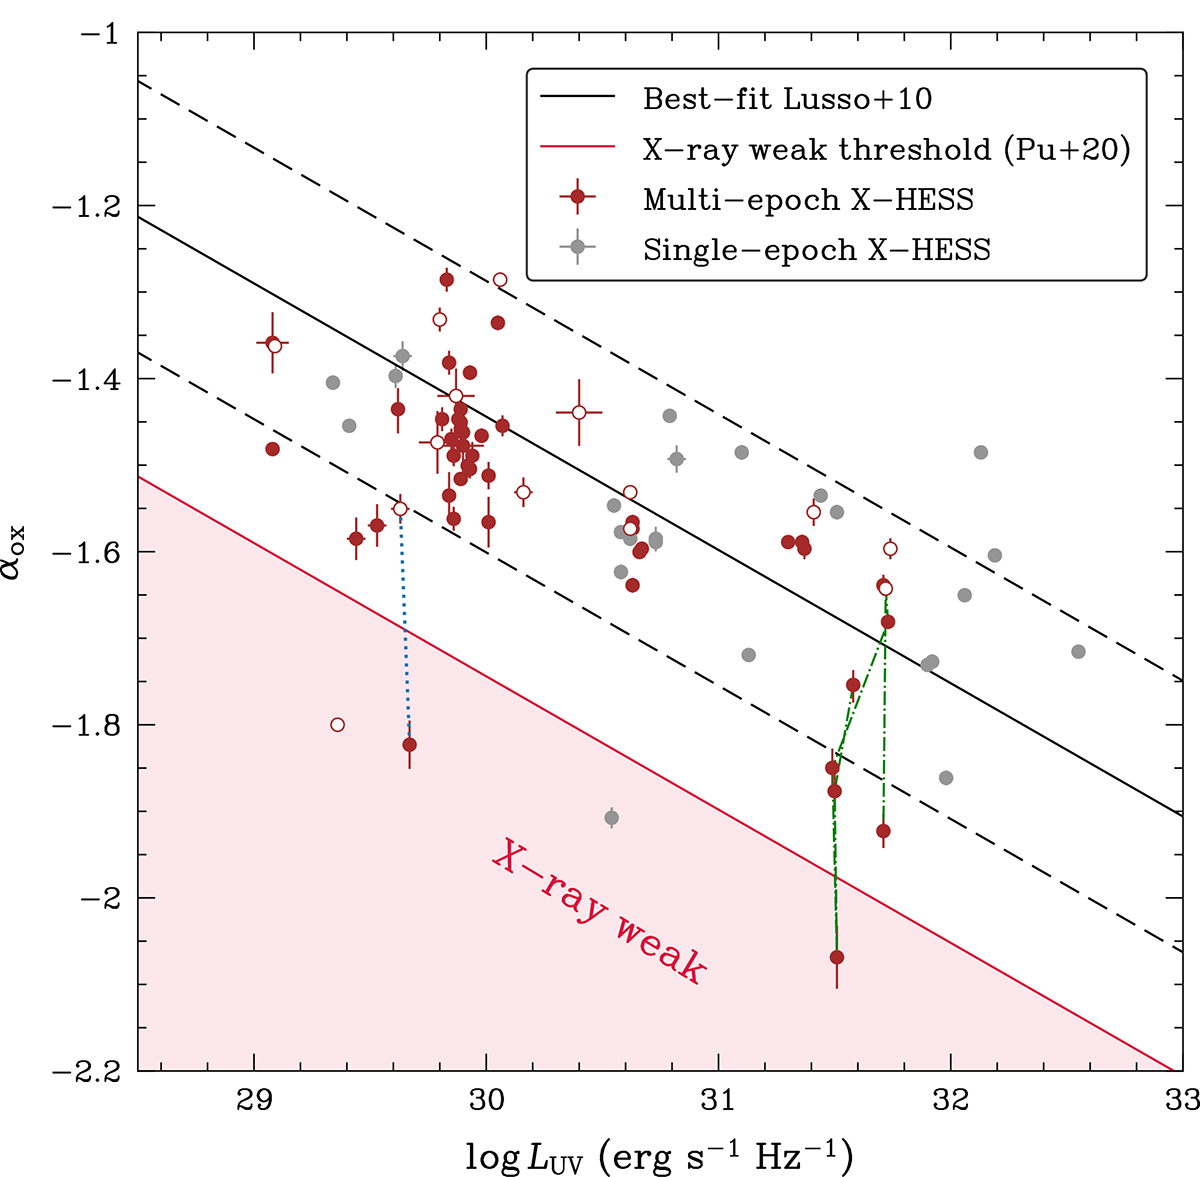
Distribution of the X-HESS AGNs in the αox − log LUV plane. Single- and multi-epoch AGNs are shown in grey and red, respectively. White circles with red edges highlight the high-flux state of the multi-epoch X-HESS AGNs. Solid and dashed black lines indicate the best-fit relation from Lusso et al. (2010) and the corresponding 1σ spread. The solid red line marks the reference value for X-ray weakness, i.e. Δαox ≤ −0.3 (Pu et al. 2020). Dotted and dash-dotted blue and green lines describe the time evolution of αox for the AGNs X-HESS 16 and X-HESS 5, respectively. Specifically, the latter has experienced a couple of transitions between phases of standard and weak X-ray emission over the different observations.
Current usage metrics show cumulative count of Article Views (full-text article views including HTML views, PDF and ePub downloads, according to the available data) and Abstracts Views on Vision4Press platform.
Data correspond to usage on the plateform after 2015. The current usage metrics is available 48-96 hours after online publication and is updated daily on week days.
Initial download of the metrics may take a while.