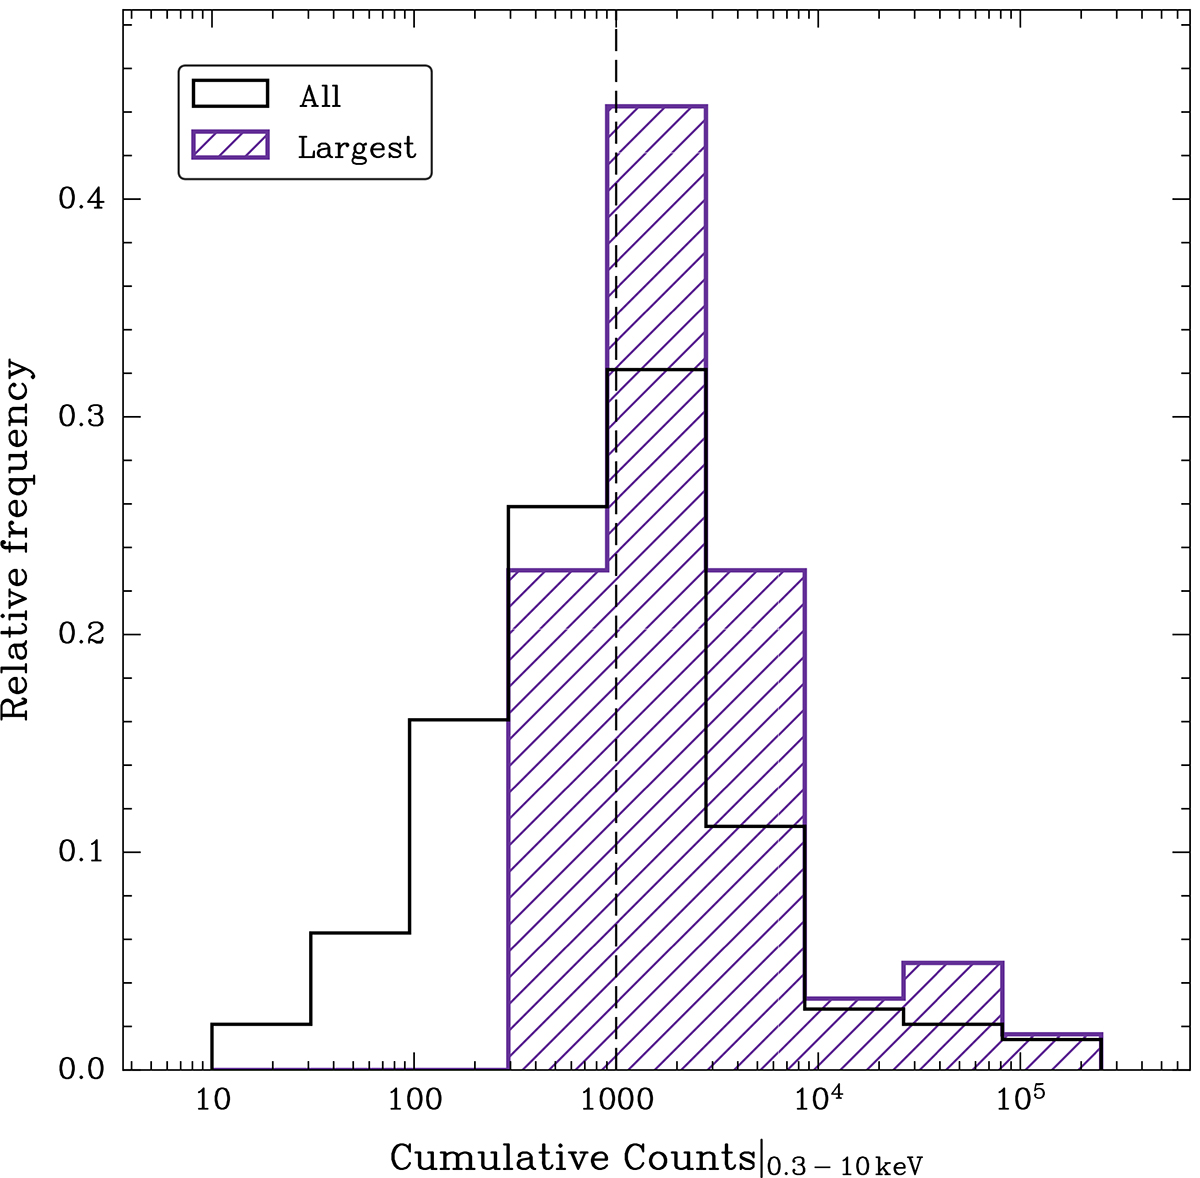
Fig. 3.
Download original image
Relative frequency histogram showing the distribution of the total net counts from EPIC-pn, MOS1, and MOS2 in the broad E = 0.3 − 10 keV observer-frame energy band for each individual observation of the X-HESS AGNs (in black). The distribution related to the observations with the largest number of counts of each X-HESS AGN is shown in purple.
Current usage metrics show cumulative count of Article Views (full-text article views including HTML views, PDF and ePub downloads, according to the available data) and Abstracts Views on Vision4Press platform.
Data correspond to usage on the plateform after 2015. The current usage metrics is available 48-96 hours after online publication and is updated daily on week days.
Initial download of the metrics may take a while.