Open Access
Fig. 2.
Download original image
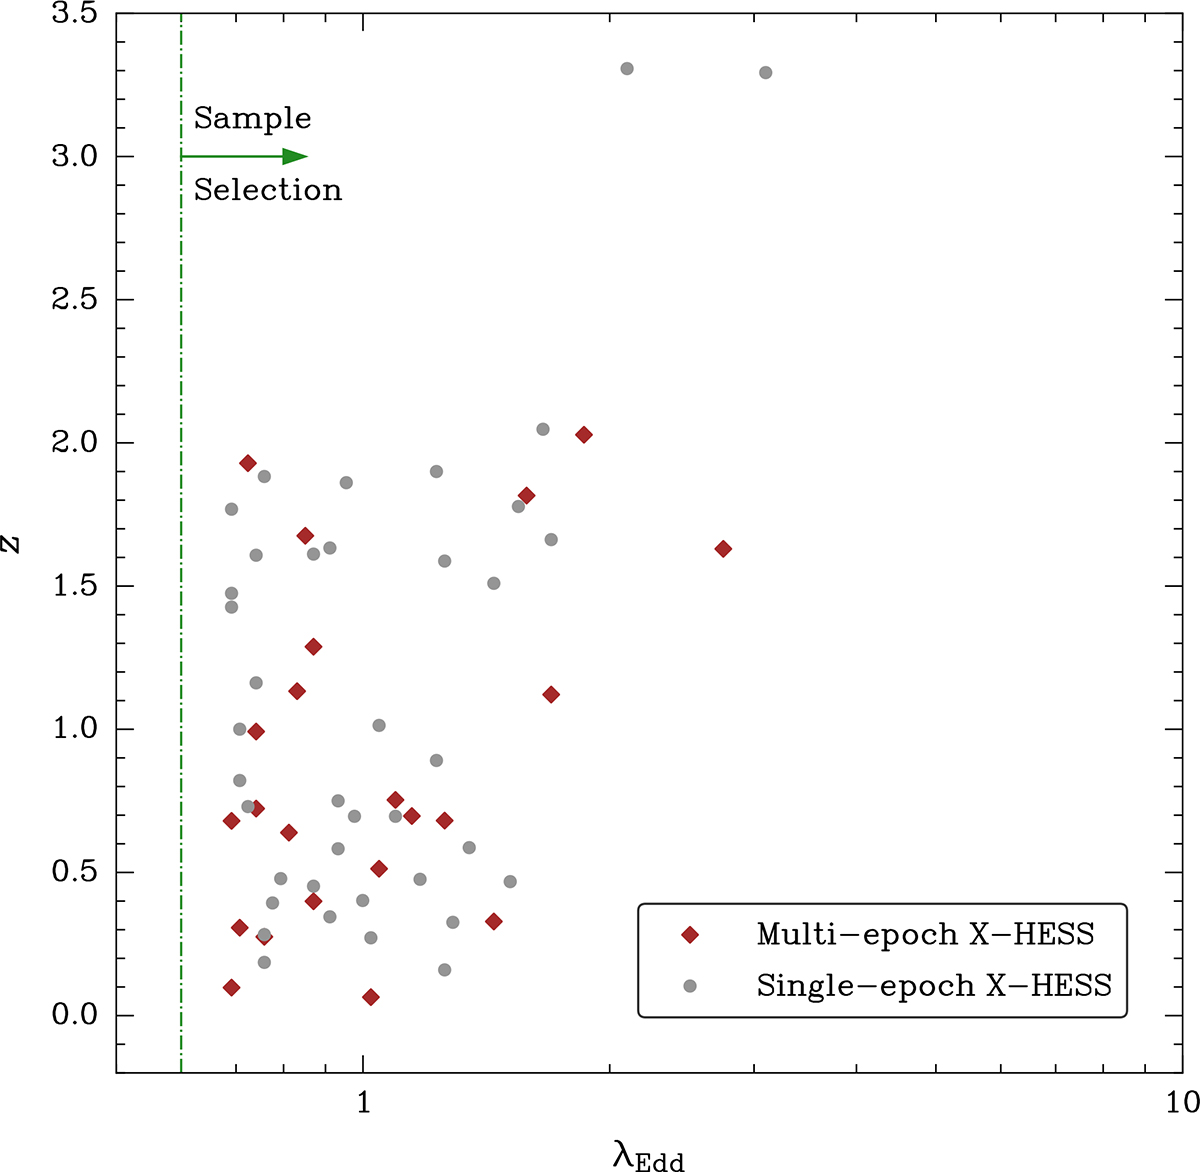
Distribution of the X-HESS AGNs in the z − λEdd plane. All the X-HESS AGNs and the subsample with multi-epoch observations are described by grey dots and red diamonds, respectively. The multi-epoch subsample is well representative of the whole sample in terms of these quantities.
Current usage metrics show cumulative count of Article Views (full-text article views including HTML views, PDF and ePub downloads, according to the available data) and Abstracts Views on Vision4Press platform.
Data correspond to usage on the plateform after 2015. The current usage metrics is available 48-96 hours after online publication and is updated daily on week days.
Initial download of the metrics may take a while.